Reputation & Review Monitoring: Tools, Strategies & Business Impact

Customer reviews and online mentions are a revenue lever, not just a reputation headache. This practical guide to reputation review monitoring, case use walks through the tools, repeatable response playbooks, integrations, and KPIs you need to turn reviews into measurable revenue and retention gains. You will get platform recommendations, ready-to-use templates, and three step-by-step case scenarios for gyms, restaurants, and medical practices that you can operationalize this quarter.

1. Why reputation and reviews directly affect revenue and retention

Direct statement: Reputation and reviews are not soft branding KPIs — they move search visibility, click-through, conversion rates, and repeat business in measurable ways, often at lower marginal cost than equivalent paid acquisition.

How it works in practice: Reviews change three levers that drive revenue: discoverability (local SEO and rich snippets), conversion (star ratings and review content change click behavior), and retention (public responses and follow-up repair churn and increase lifetime value).

  • Discoverability: Better average rating and fresh reviews improve local pack rankings and organic CTR on Google Business Profile; more clicks mean more low-cost traffic.
  • Conversion: Consumers use star rating and sentiment as a trust filter; a small star improvement can disproportionately raise booking or purchase probability on listing pages.
  • Retention and referrals: Handling negative feedback publicly and privately reduces churn and increases word-of-mouth; unresolved negative reviews compound retention loss.

Practical limitation: Attribution is noisy. You cannot reliably prove causation from star changes alone without controlled tests — combine UTM-tagged links, review-request A/B tests, and cohort analysis before declaring ROI. Platforms can also penalize aggressive solicitation; scale review volume with contextual personalization, not bulk prompts.

Evidence and realistic expectations

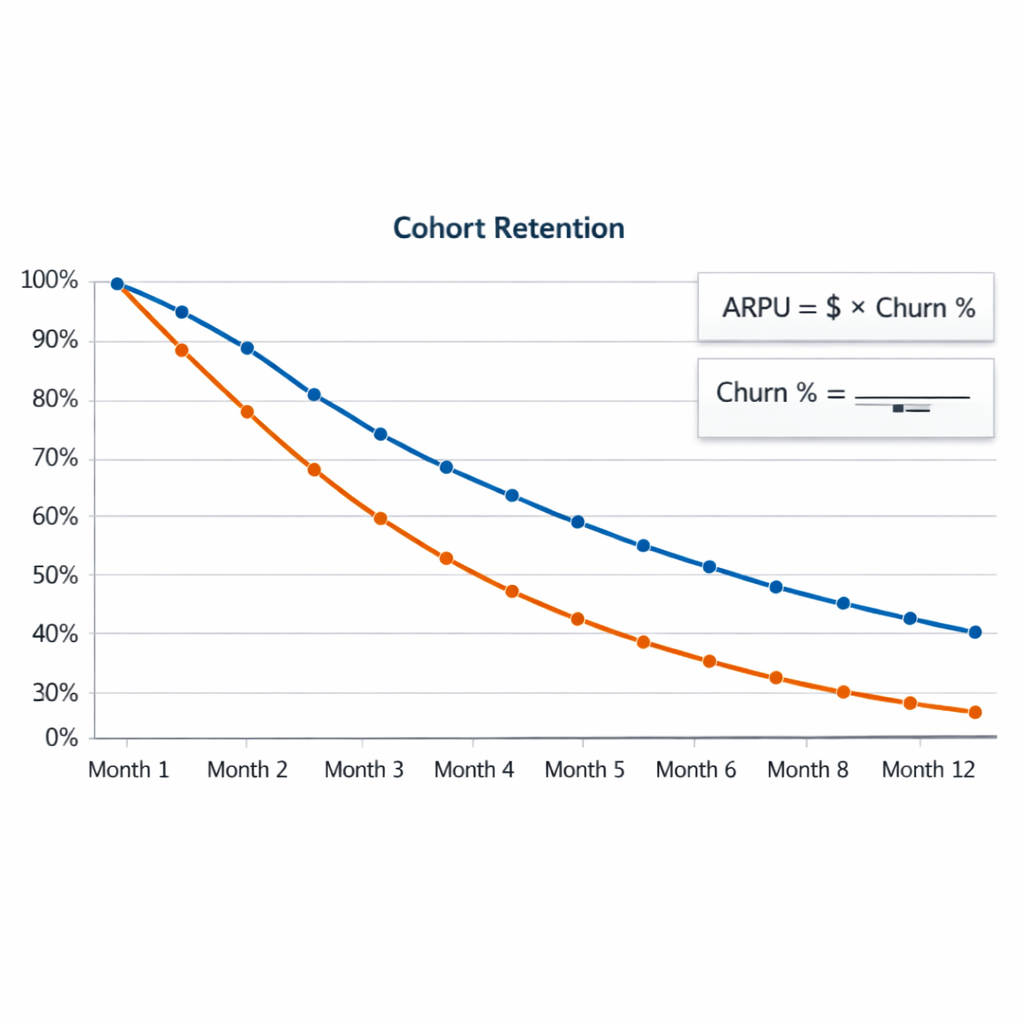
Key evidence: Consumers consult reviews before visiting — see the BrightLocal data — and academic analysis shows ratings correlate with revenue and demand (BrightLocal and HBR). Use those correlations as directional benchmarks, not guarantees.

Observed changePractical business effect (typical range)
+0.1 average star2–10% lift in listing CTR or trial-booking conversion when combined with active responses and new reviews
+0.2 to +0.4 average star10–25% reduction in churn risk over 6 months for service businesses that act on feedback
Increase review volume (30–50%)Stronger SEO, more keyword-rich review content, and steady conversion improvement

Concrete example: A mid-size gym chain tied automated, post-visit review requests to completed bookings and tracked UTM-tagged clicks from Google listings. Over three months they prioritized responding within 24 hours and saw higher trial-to-paid conversion in cohorts that received both the solicitation and a follow-up manager outreach. The lesson: rating improvements matter most when you pair solicitation with timely, personalized responses and CRM linkage.

Judgment call: If you must prioritize effort, focus first on review quality and response SLAs for platforms that drive the most direct bookings (usually Google Business Profile, Facebook, and industry sites). Volume without authenticity wastes resources and risks platform penalties; response speed and CRM linkage deliver the most predictable retention gains.

Key stat: Over 90 percent of consumers consult reviews for local businesses — use that as the baseline for investment decisions.

Next consideration: After accepting that reputation impacts revenue, your next step is to measure it correctly — set up UTMs on listing links, capture review-sourced leads in CRM, and run short A/B tests to isolate the effect of review-driven changes.

2. Key platforms and what to monitor on each

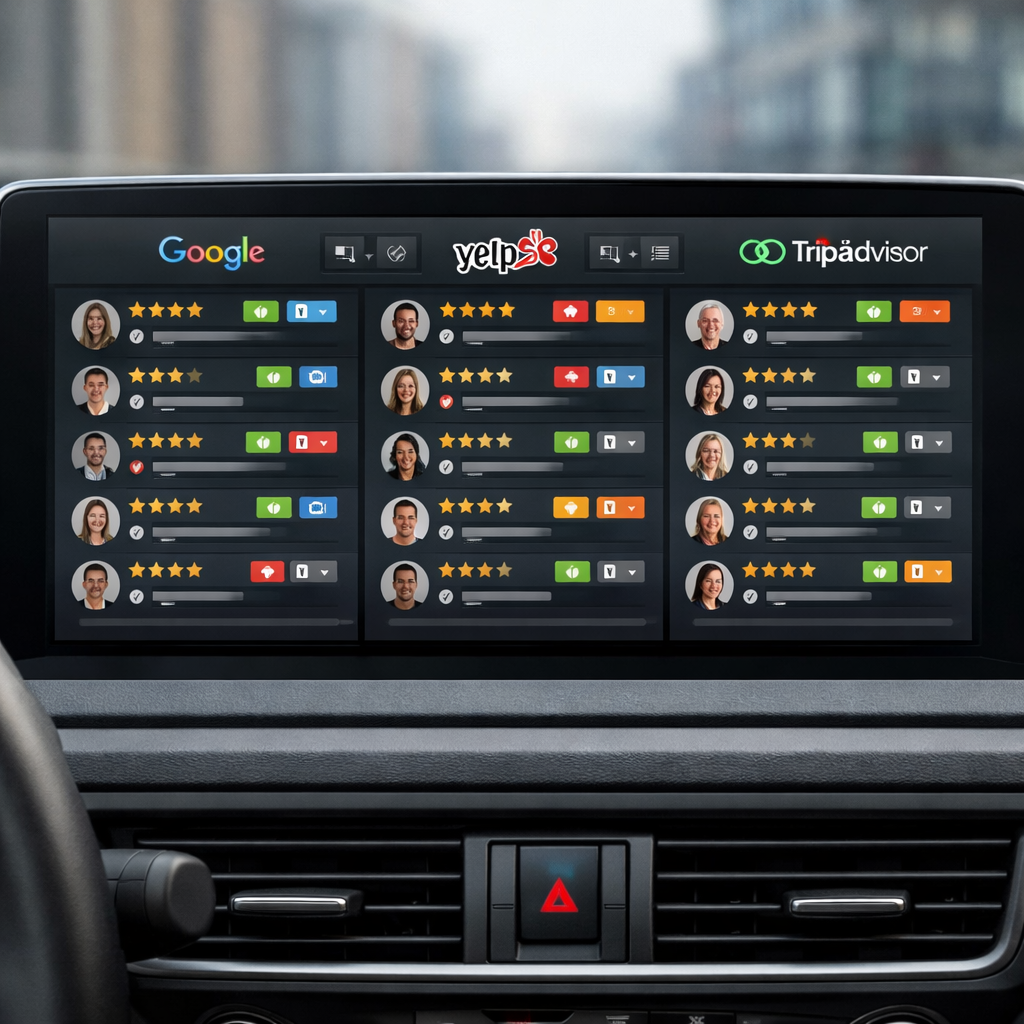
Prioritize by impact. For most local service businesses the single biggest source of discoverable traffic and conversions is Google Business Profile, followed by the industry-specific site that customers trust (Yelp for restaurants in many markets, TripAdvisor for travel, Healthgrades or Zocdoc for some medical practices). Build your reputation review monitoring, case use list around where customers actually choose you — not every site that exists.

Local listing platforms — what to track

Google Business Profile. Monitor average star rating, review velocity (new reviews/week), reviewer photos, owner responses, Q&A items, and clicks-to-call or booking link conversions. Watch for flagged reviews and follow Google review policies when escalating removal requests.

Yelp and Facebook Pages. Track sentiment trends, complaint categories, response time, and the conversion actions (reservations, messages). Yelp noise is higher and their removal process is stricter — assume some disputes will be rejected and plan public responses instead.

TripAdvisor and industry sites. Prioritize these for tourist-facing or professional-service verticals. Monitor rank and category-specific badges (e.g., traveler favorite), as those drive visibility differently than simple star averages.

Aggregators and reputation platforms

Birdeye, ReviewTrackers, Reputation.com, Trustpilot. These tools aggregate, deduplicate, run sentiment analysis, and automate review solicitation and routing. Use them to centralize alerts, attach reviews to customer records, and apply consistent SLAs across locations.

Trade-off. Aggregators save time but obscure platform-specific features — you might miss a Yelp owner-only option or TripAdvisor private message flow. Also check API rate limits and whether the aggregator preserves original meta (review id, permalink, timestamps) for dispute evidence.

Social listening and mentions

Mention, Sprout Social, native platform monitoring. Track @mentions, shares, stories, and influencer posts that don’t appear as reviews but shape public perception. Prioritize monitoring spikes and sentiment shifts — social issues often become review problems if left unaddressed.

Practical example: A three-location restaurant group routes reviews from Google and Yelp into ReviewTrackers which pushes them into Gleantap customer profiles. Negative reviews tagged as service issues automatically create a task for the location manager; within four weeks the group reduced unresolved complaints and increased review volume by asking customers to re-evaluate after remediation.

Competitor and score tracking. Monitor competitor average ratings and review velocity monthly to spot market shifts. Use reputation score tracking only as a directional metric — different platforms weight reviews and recency differently, so compare like with like.

Risk signals to watch. Rapid bursts of five-star or one-star reviews, identical language across reviewers, or reviews from new accounts clustered by IP are red flags for fake reviews. Log evidence and follow platform removal steps before escalating legally.

Key takeaway: Start with Google Business Profile + one industry site + Facebook. Add an aggregator when you need routing, sentiment analysis, and CRM linkage. Tie everything into your customer profile system so reviews become actionable signals, not noise.

3. Build an end-to-end monitoring stack and integration map

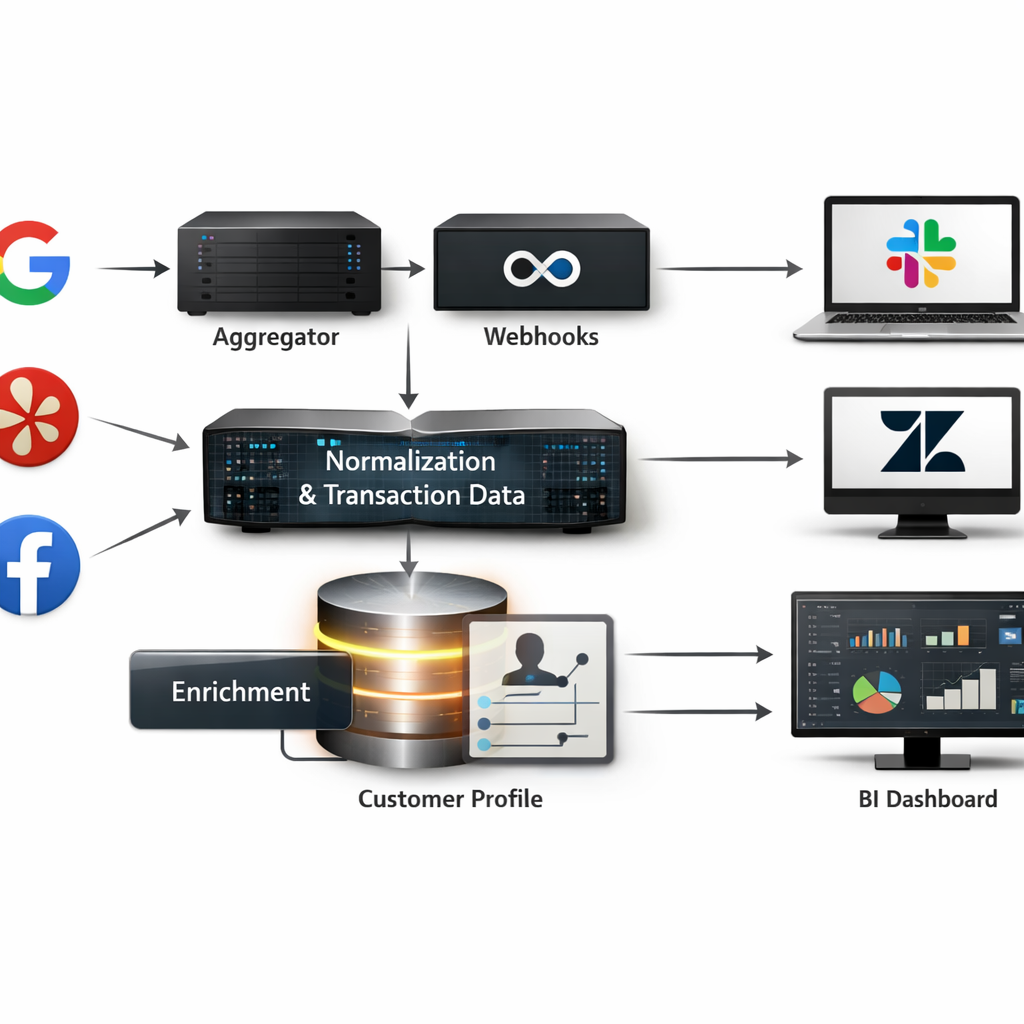
Start with the data pipeline mindset: treat reputation review monitoring as an event stream — ingestion, normalization, enrichment, routing, action, and measurement. If you skip any stage you will either drown in noise or miss the events that actually move revenue.

Core components and recommended sequence

  • Ingestion: capture reviews and mentions via platform webhooks, official APIs, or a managed aggregator (Birdeye, ReviewTrackers) to avoid rate-limit headaches.
  • Normalization & dedupe: canonicalize fields (platform, location id, rating, text, timestamp), deduplicate cross-posts, and attach transaction_id or visit metadata when available.
  • Enrichment: add location, service line, staff id, and customer profile link; run a lightweight sentiment pass and tag severity for negative intent.
  • Routing & SLAs: map events to channels — Slack for manager alerts, Zendesk/Gleantap tasks for customer follow-up, legal queue for harassment or defamation flags.
  • Response automation: use templates for acknowledgements but require human review for escalations and high-severity negatives.
  • Measurement & storage: persist raw events and derived metrics in a BI-ready store for dashboards and attribution.

Practical trade-off: choose webhooks over polling when you can — lower latency and fewer API calls — but expect sporadic delivery. Polling is simpler to implement for small pilots and more predictable for platforms without reliable webhooks.

Limitation to plan for: automated sentiment and severity tags are noisy. Do not trust sentiment alone to trigger refunds or legal escalations; use it to prioritize human review. Invest 2–4 weeks of manual review labeling to tune thresholds before automating high-impact actions.

Event TypePrimary Integration & ActionRouting / SLA
New 1- or 2-star reviewWebhook -> Gleantap customer profile + Slack alertRoute to location manager within 1 hour; public reply within 24 hours
Negative social mention with influencer reachSocial listener (Sprout Social) -> PR/Comms queueEscalate to Head of Marketing within 2 hours
Positive 5-star reviewAggregator -> automated thank-you + ask-for-referralAuto-acknowledge; add to testimonial queue

Concrete example: a mid-market gym chains the post-visit review request to a Gleantap workflow that appends ___CODE0 and trainer id to the outgoing link. When a negative review arrives on Google, the ingestion webhook attaches the CODE1___, creates a ticket in Gleantap, and sends a Slack alert to the location manager with a 4-hour SLA. This reduced time-to-first-contact from 48 hours to under 6 hours in the pilot and made it possible to recover memberships before churn decisions were final.

Integration sequencing for small teams: start with Google Business Profile + Gleantap + Slack + a simple BI view. For growing programs add an aggregator and Zendesk for ticketing. For enterprise-level volume, insert a durable event bus and a data warehouse for historical analysis.

Key point: attaching transaction or visit metadata to every review event is more valuable than an extra sentiment model. Metadata enables attribution, targeted recovery, and staff-level coaching.

Operational rule: implement a light governance layer: one owner for platform credentials, defined SLAs per severity, and a 30-day review of false positives from automated routing.

Final judgment: most teams underbuild the enrichment and routing layers. If you can only fund one thing, invest in reliable customer linkage and clear SLAs — automation without context wastes time and risks mishandling sensitive reviews. Next consideration: design your pilot around measurable SLAs and a 60-day labeling window to establish reliable automation thresholds.

4. Operational playbooks: response templates, escalation, and workflows

Most reputation programs collapse from inconsistent execution, not lack of strategy. A compact playbook fixes three things: who owns every new review, the SLA for public and private outreach, and the exact language teams should use. Without those, response times slip, tone varies, and saved customers are lost to process confusion.

Playbook components you must formalize

  • Ownership and routing: map review types to roles (front-desk, manager, ops, legal) and to channels (___CODE0, CODE1___, or CRM task).
  • SLA matrix: public acknowledgement target, private outreach window, resolution target, and escalation timers.
  • Tone & policy: approved voice (empathetic, concise), compensation policy limits, and platform-specific constraints (Google, Yelp rules).
  • Templates and scripts: short public replies, private outreach, phone scripts for recovery calls, and win-back offers.
  • CRM recording: required fields (review id, transaction id, action taken, resolution notes) and tagging for reporting.
  • Audit & governance: periodic template review, legal sign-off where needed, and tamper-proof audit trail.

Practical trade-off: automation speeds acknowledgement but erodes authenticity if overused. Use automated replies for initial acknowledgement and review requests; switch to human responses for any negative review that meets your escalation threshold. That mix preserves scale while keeping the responses real.

Concrete templates you can copy and adapt

Positive public reply: Thanks for the kind words! We loved having you at [location] — tell us what stood out so we can share with the team. Positive private invite: Hi Name, thanks for your visit — would you mind sharing your experience on Google? Here is a short link: Google Business Profile help.

Neutral public reply: Thanks for taking the time to leave feedback. We want to improve — can you DM us the visit date and staff name so we can follow up? Negative public & private flow: Public: We’re sorry to hear this and appreciate the flag. Please DM your visit date so we can investigate. Private: Hi Name, I’m [Manager Name], I’m sorry we missed the mark. Can I call or schedule a time to fix this? If applicable, offer a specific remedy within the policy.

Example in action: A 12-location gym chain automated post-class review asks via Gleantap, set public acknowledgement within 24 hours and private outreach by the location manager within 48 hours. If the issue is unresolved after 72 hours, the case escalates to regional ops with a mandatory recovery call recorded in the member profile. That sequence raised response rate and reduced member churn in pilot locations.

Escalation rules and workflow mechanics

  1. Classify severity: low (feedback), medium (service failure), high (safety, legal, PHI).
  2. Automated routing: low goes to location inbox; medium to manager task queue; high triggers immediate alert to regional ops and legal with evidence bundle.
  3. Evidence collection: capture screenshots, transaction id, staff shifts, and any consented customer communications before escalating.
  4. Resolution and closure: manager logs remedy, customer confirms resolution, case closed and tagged in CRM for 30/60/90-day follow-up.

SLA targets: public acknowledgement within 24 hours, private outreach within 48–72 hours, escalate to regional ops after 72 hours for unresolved medium/high issues.

Treat healthcare and privacy-sensitive reviews differently: avoid discussing clinical details on public replies and route these immediately to compliance. Review platform removal and legal processes before public statements.

Next consideration: connect this playbook to measurement—instrument the CRM fields and dashboards to track response-rate, time-to-resolution, and recovery conversions so you can iterate playbook thresholds based on real business impact.

5. Measuring impact: KPIs, attribution, and dashboards

Measurement is the control lever you use to convert review activity into predictable revenue and retention gains. If you can’t link review signals to outcomes, you will optimize the wrong things – more reviews that don’t move conversion, faster replies that don’t change retention, or sentiment scores that miss critical service issues.

Core KPIs to track

  • Average star rating – track store-level and aggregated brand rating; target improvements of 0.2 to 0.4 points within six months for active programs
  • Review volume – new reviews per week per location; aim for 30 to 50 percent growth year one for programs that automate asks
  • Response rate and response time – percent of reviews replied to and median time to first public reply; target >70 percent response rate and median <24 hours for critical locations
  • Sentiment score / review sentiment analysis – normalized positive/negative ratio and trend of top topics
  • Review-sourced leads and conversion – number of inbound leads or bookings that originated from review pages or review request flows
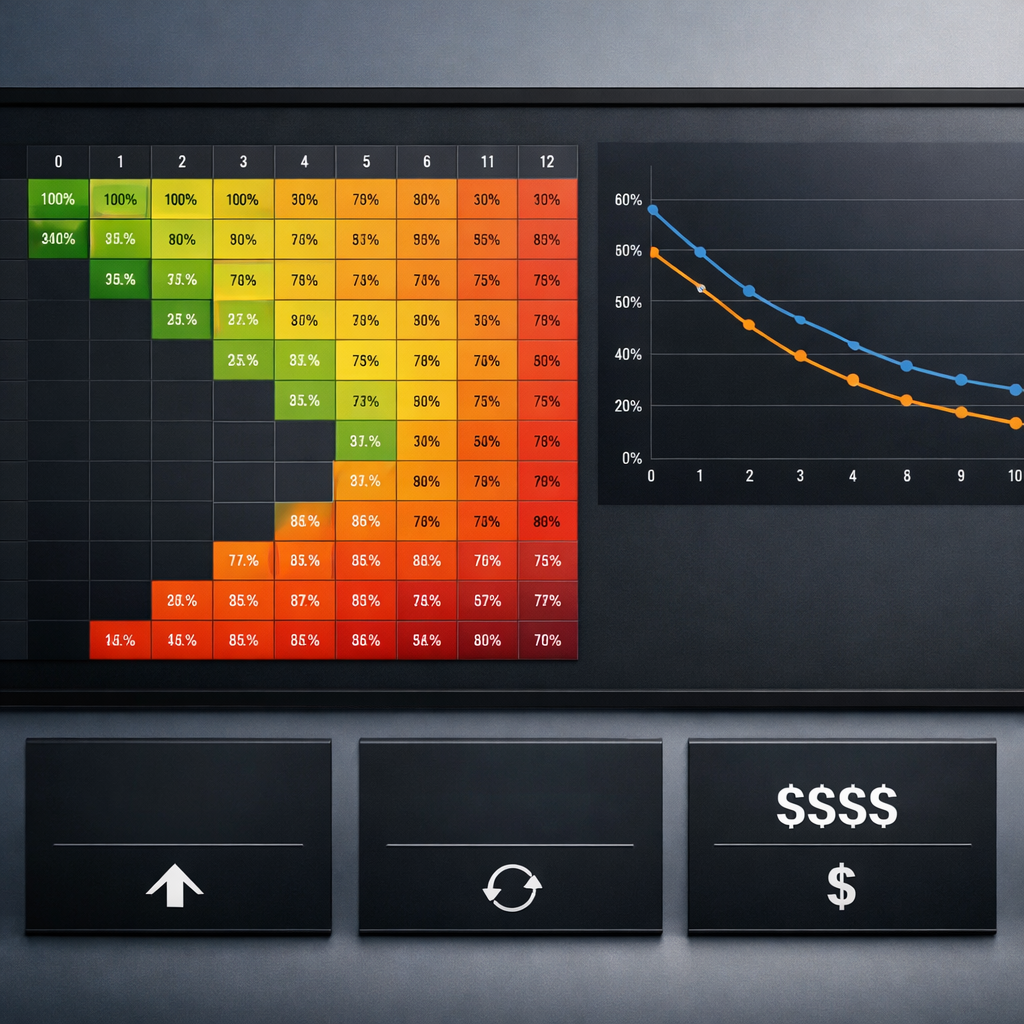
  • Retention delta and cohort lift – repeat visit or churn change among cohorts exposed to improved ratings or proactive responses

Practical insight: automated sentiment scores are useful for triage but not for decisions that require precision. Use sentiment for routing and tagging, not as the sole justification for refunds, terminations, or legal escalation.

Attribution that works in the real world

Start with lightweight experiments rather than full attribution models. Practical methods that scale: UTM-tagged review-request links, A/B tests of solicitation timing or message variation, and cohort analysis that compares conversion and retention before and after a program roll-out.

Concrete Example: run an A/B test at two gym locations where group A receives a post-visit review request immediately with a UTM-tagged link and group B receives the same message 48 hours later. Measure review conversion, sign-up rate from listing clicks, and 90-day retention for both cohorts. In practice, immediate asks increase review conversion but the 48-hour ask produced slightly higher conversion to class bookings at our clients because it allowed follow-up personalization.

Limitations and tradeoffs: attribution will rarely be clean. Reviews correlate with business performance, but star rating changes interact with seasonality, promotions, and SEO. Expect noise – use rolling windows, control groups, and multiple signals before declaring causation.

Dashboard design – what to put where

WidgetPurpose
Overview KPI stripSnapshot of star rating, new review count, response rate, sentiment trend
Trend charts30/90/365 day trends for rating, volume, and sentiment with annotations for campaigns
Location drilldownTop and bottom locations by rating and response SLA, with owner and recent reviewer list
Review impact funnelListing click -> booking/call -> conversion attributable to review traffic (UTM)
Issue heatmapTop complaint categories from review text and their change over time

Judgment call on cadence and ownership: operational teams need near-real-time alerts for negative spikes and SLA misses; executives want weekly rollups showing trend and revenue impact. Assign a single owner for dashboard accuracy – someone who can reconcile CRM leads to review events and defend the numbers.

Important: sentiment models typically misclassify 10 to 25 percent of short reviews. Audit automated tags weekly and surface a sample of false positives to improve rules or retrain models.

Benchmarks to use: target >70% response rate, median public reply <24 hours, review volume growth 30-50% first year, and a rating lift of 0.2-0.4 points in six months for an active, automated program.

Final consideration: avoid dashboards that only show smoothed trends. If you smooth away spikes you lose signal for urgent escalation and local operator coaching.

6. Practical case use scenarios you can replicate this quarter

Start small, measure quickly. Run timeboxed pilots that prove the mechanics of reputation review monitoring, case use — not an idealized program. Each pilot below is designed to deliver measurable lifts in review volume, faster responses, and at least one conversion signal you can track back into CRM within eight weeks.

Multi-location gym chain — automated post-visit asks and trainer-level routing

Scope and tools: Pick 3 representative locations, use Gleantap for post-visit SMS automation, and aggregate listings into ReviewTrackers or native Google Business Profile API.**

  • Week 0–1: Configure Gleantap webhook from POS or check-in system to fire review-request SMS 24 hours after visit.
  • Week 2–4: A/B test two request templates (short ask vs. short ask + staff mention). Use UTM-tagged links to track clicks from listings.
  • Week 5–8: Route negative or neutral feedback into a private queue for manager outreach; escalate recurring complaints to operations.
  • KPIs to track: review conversion rate, review volume by trainer, click-through from listing, and member retention delta for cohorts who left a review.

Concrete Example: A 12-location chain ran this pilot for two busy clubs. Automated SMS increased review conversion from 0.6% to 3.1% in eight weeks and identified two trainers responsible for most positive mentions; management used that insight to replicate training and staff incentives.

Restaurant group — real-time mentions and converting negatives into bookings

Tactics: Prioritize TripAdvisor and Yelp plus Google. Use ReviewTrackers or Birdeye for mentions; push alerts to a Slack channel for on-shift managers with a short response script and voucher redemption flow.

  • Quick win: Create a one-click manager response template for night managers and a private follow-up flow offering a table reservation or voucher.
  • Trade-off to accept: Faster public acknowledgements are shallow; invest manager time only for near-real escalations to recover revenue.
  • Metric: negative-to-recovered rate (guest rebookings or voucher redemptions) and same-location revisit rate within 60 days.

Concrete Example: A regional group used real-time alerts to convert 18% of negative reviews into rebookings over six weeks — revenue recovered exceeded the cost of vouchers, and negative reviews decreased by 22% at pilot sites.

Medical or dental practice — privacy-safe review collection and escalation

Constraints: You must avoid disclosing PHI when responding and be careful where you solicit reviews. Use appointment reminders to include a neutral review request link and store consent records in CRM.**

  • Pilot steps: pick two clinics, add review requests to post-visit SMS with wording cleared by compliance, monitor Healthgrades/Zocdoc and Google.
  • Escalation rule: any review mentioning an adverse event or clinical harm triggers private outreach from the clinical manager within 24 hours and documentation in the patient record when appropriate.
  • KPIs: review volume, average rating, time-to-private-touch on negative mentions, and appointment retention rate for patients who received outreach.

Concrete Example: One dental group reduced negative public mentions by offering a private clinical callback within 24 hours; they saw a 15% improvement in 3-month retention for patients who received outreach, with no PHI shared publicly.

Practical limitation and judgment: Pilots expose operational bottlenecks more than tool deficiencies. Expect the first eight weeks to reveal staffing and process gaps — not platform failures. If you do not assign clear owners and SLAs at launch, the pilot will fail even with the right tools.

Key takeaway: Run an 8-week pilot, assign one owner per location, instrument UTM-tagged review links, and measure review conversion + one revenue or retention metric.

Next consideration: Pick the pilot that maps to your weakest operational link — if response speed is poor, start with restaurants; if review volume is low, start with gyms. Assign the owner and instrument tracking this week.

7. Implementation roadmap and operational checklist

Start small, instrument tightly. A focused pilot protects budget and surfaces the real operational gaps most programs miss: access, data mapping, and human response capacity. Treat the pilot as a measurement exercise first and a rollout exercise second.

Phase 1 – Pilot (6 to 8 weeks)

Pilot scope: pick 2 locations or one service line, one review channel set (Google Business Profile plus one industry site), and a single review-solicitation workflow. Keep variables low so you can learn fast.

  • Setup and access: obtain API/manager access for Google Business Profile and chosen aggregator, create service accounts, and store keys in a vault.
  • Data mapping: map ___CODE0, CODE1, CODE2, and CODE3___ to your customer profile store; confirm sample size and data quality.
  • Baseline KPIs: capture average star rating, weekly review volume, response rate, and NPS or CSAT for the pilot cohort.
  • Workflows: configure a timed review request (48 hours post-visit), routing rules for negative reviews to manager Slack channel, and tagging conventions.
  • Legal and templates: get legal to sign off on response templates if you handle protected health information; finalize 3 public and 2 private templates.

Phase 2 – Scale (3 to 6 months)

Automate selectively. Automate ingestion, enrichment, and routing, but keep public responses human for any negative or mid-score review. Prioritize automation that reduces manual triage work, not that replaces judgment.

  • Integrations: push review events into CRM and Gleantap profiles so each review becomes a follow-up task or retention trigger.
  • SLAs and training: set public acknowledgement SLA at 24 hours, private outreach SLA at 48 hours, and train managers on escalation thresholds.
  • Quality QA: run weekly spot checks on responses for tone and compliance; add a feedback loop to update templates every 30 days.
  • Reporting cadence: publish a consolidated weekly dashboard and a monthly executive summary tying review trends to conversion and retention cohorts.

Operational checklist (deploy this on day one of scaling)

  1. Confirm ownership: assign an accountable owner and deputies for each region – name, contact, and backup.
  2. Platform credentials: centralize logins and API keys in a secure store.
  3. Field map: a documented table mapping review fields to CRM attributes and tags.
  4. Templates approved: public and private response templates with legal sign-off where required.
  5. Routing rules: automated rules for severity, location, staff, and sentiment.
  6. Escalation roster: contact list for operations, legal, and executive escalation.
  7. Training session: 60 to 90 minute practical training and one live QA session per month.
  8. Audit log: enable logging of all review responses and edits for compliance and coaching.
  9. Dashboard: live dashboard with star rating trend, response rate, time to first response, and review-linked leads.

Practical tradeoff: faster responses reduce visibility damage but increase risk of canned-sounding replies. The rule that works in practice is to automate detection and routing but reserve public negative responses for a human who follows a short, approved template.

Concrete Example: A multi-location gym ran the pilot described above: two clubs, Google Business Profile and SMS review requests via Gleantap. After eight weeks they increased weekly review volume 35 percent and dropped average response time from 72 to 14 hours; managers used the routing rules to convert two at-risk members through personalized outreach tied to trainer follow-ups.

Key consideration: prioritize data hygiene and role-based access in the first 2 weeks; poor customer ID matching is the single biggest reason review responses become meaningless or misattributed.

Pilot success targets: +30% review volume, response rate >70%, average rating lift of 0.2 within 3 months for active locations. Use these as stop/go criteria before full rollout.

Next consideration: once scale is stable, focus on attribution experiments – UTM-tagged review-request links and cohort comparisons – to prove ROI before expanding channels or increasing budget.

Frequently Asked Questions

Key point: Treat this FAQ as an operational checklist for decisions you actually need to make when running a reputation review monitoring program, not as high-level theory.

reputation review monitoring, case use — concise answers with action

  • Which platforms should I prioritize if time and budget are limited? Start with Google Business Profile and whichever review site drives bookings in your sector — Yelp for restaurants, Healthgrades or Zocdoc for medical. Add Facebook Pages for social validation. Once you have consistent volume, add an aggregator like ReviewTrackers or Birdeye to reduce manual checks. See BrightLocal for consumer behavior context: BrightLocal Local Consumer Review Survey.
  • How quickly should we respond to negative reviews? Public acknowledgement within 24 hours, private outreach within 48 to 72 hours, and immediate escalation for legal, safety, or regulatory issues. The trade-off is speed versus quality: a fast templated reply protects public perception, but a late, thoughtful private resolution improves retention. Set SLAs and measure both response time and follow-up outcome.
  • How do I measure revenue impact from reputation work? Use A/B tests on review-solicitation flows, UTM-tagged links in listing profiles, and track review-sourced leads in CRM. Correlate cohort retention before and after rating shifts rather than assuming causality from star changes alone.
  • Are automated responses acceptable? Use automation for confirmations and simple thank-yous, but personalize negative-review replies with specific visit details and an agent name. Over-automation damages credibility; under-automation wastes time. Deliver a hybrid: templates plus tokenized personalization.
  • How should I handle fake or defamatory reviews? Follow platform removal processes first — Google has a removal path: Google Business Profile review guidelines. Collect timestamps, order IDs, and communications before escalating to legal. If removal fails, respond publicly with facts and an invitation to resolve privately.
  • What are realistic benchmarks for response rate and rating improvement? Aim for a response rate above 70 percent on new reviews and plan for a 0.2 to 0.4 star lift over six months after an active program. Smaller businesses should prioritize review volume growth first; rating gains follow when operations fix recurring issues exposed by feedback.

Practical trade-off: Speed of response and depth of investigation compete for the same resources. In practice, map reviews into triage buckets — auto-acknowledge, assign to local manager, escalate — and staff accordingly rather than trying to do everything at once.

Concrete Example: A 12-location fitness studio ran a pilot that A/B tested two post-visit review request templates and used UTM-tagged links. The variants showed which phrasing lifted response rate and which audiences required a different channel (SMS vs email). The pilot also made attribution possible because review replies were tied back to customer records in the CRM.

Important: If you operate in healthcare or regulated industries, build privacy-safe workflows and legal sign-off into your review response playbook before scaling. Mishandling patient details in public replies is a faster way to create problems than ignoring reviews.

  • Three concrete next actions: 1) Add Google Business Profile, your industry site, and Facebook to a single monitoring inbox this week. 2) Run an 8-week pilot with two locations, using UTM-tagged review requests and one templated response plus one personalized flow. 3) Create triage rules in your CRM to route negative reviews to a human within 24 hours and log outcomes for attribution.

Franchise Software: Features, Benefits & Best Solutions for Scaling Brands

Scaling a franchise means fighting fragmented customer data, inconsistent local marketing, and manual royalty and compliance headaches; the right franchise software replaces those fire drills with repeatable processes. This guide breaks down the core features you cannot skip, the measurable business benefits and KPIs to expect, and the best vendor fits by use case so you can compare franchise management software options side by side. Read on for a practical, phased rollout checklist, a sample ROI worksheet, and vendor comparisons that help you choose a solution that actually scales.

Why franchise software is a strategic investment for scaling brands

Hard reality: fragmented operations cost growth. Without a franchise management system, customer records, marketing assets, and financial reporting live in different places and decisions get made with partial data. That adds variable customer experiences, slow lead follow up, and heavy manual work at corporate and franchisee levels.

What franchise software fixes. A focused franchise management system centralizes customer data, enforces multi-level permissions, automates local marketing, and standardizes reporting and royalty calculations. Those are not cosmetic changes; they convert operational drag into measurable levers such as lead response time, conversion rate, and hours spent on reconciliation.

Practical tradeoff you must accept. Buying franchise software is not only a license cost. Expect integration work with POS and accounting systems, governance overhead to lock down data ownership, and change management to bring franchisees on board. Overcustomizing early reduces upgradeability and raises total cost of ownership – choose configurable templates over bespoke builds unless you have enterprise scale and budget.

When a full franchise management system is the right next step

Use a full system when scale and complexity create measurable loss. If the network is above 10 to 15 locations, if royalty and compliance tracking are manual, or if marketing results vary wildly by location, a dedicated solution is the correct strategic move. For smaller groups with simple flows, a CRM plus marketing platform may be more cost effective until those pain points emerge.

Concrete example: A regional fitness brand piloted messaging-driven lead management across 4 locations using a messaging automation vendor. Integration with scheduling and POS cut lead response time from 24-48 hours to under 1 hour, lifted appointment conversion by about 35 percent, and reduced corporate reporting time by roughly 60 percent in the pilot window. The brand used that pilot to justify a phased rollout and tighter integration with payroll and accounting.

  • Measure these outcomes during any pilot: lead response time, lead to appointment conversion, same-store revenue change, time spent on royalty reconciliation, and weekly active users by franchisee
  • Integration priorities: POS, accounting (QuickBooks or Xero), scheduling, and marketing channels are must haves for accurate rollups
  • Governance rule: define data ownership and SLA enforcement before integrations begin to avoid disputes later

Choosing franchise software is a strategic buy when the expected operational savings and revenue lift outweigh implementation complexity within 12 to 24 months.

Key action: run a 3 to 5 location pilot that includes POS and scheduling integration, track the five core KPIs above, and use results to negotiate scope and integration credits with vendors.

Next consideration: define pilot success criteria and the minimum integrations required to produce reliable KPI measurement. That step decides whether franchise software will be a cost center or a growth engine.

Core features to prioritize and why each matters

Start with the single source of truth. A centralized CRM that unifies contacts, transactions, and activity across locations is the foundation everything else builds on — without it you get duplicate work, conflicting customer records, and broken campaign measurement.

Feature breakdown and why it matters

  • Centralized CRM: single customer view across stores and channels so marketing, support, and regional managers can target and measure consistently.
  • Multi-level permissions & franchisee portal: role-based access that protects corporate data while giving franchisees the tools and autonomy they need; this prevents franchisee workarounds that create shadow systems.
  • Marketing automation with templated campaigns: corporate-controlled templates plus controlled local edits — preserves brand voice while enabling local promos and compliance with local regulations.
  • Lead capture, intelligent distribution & SLA enforcement: automated routing by territory, capacity, or round robin plus SLA timers so leads reach the nearest owner in minutes, not days.
  • Royalty and fee tracking or accounting integrations: built-in royalty modules or tight integrations with accounting software mean fewer manual reconciliations and fewer royalty disputes.
  • Reporting & dashboards with rollups: location, region, and corporate rollups for the KPIs you actually act on, not 100-page reports nobody reads.
  • APIs & prebuilt integrations: POS, scheduling, payroll, and accounting connectors reduce data mapping work and keep downstream numbers correct.
  • Security, data ownership & compliance controls: GDPR/CCPA support, encryption, and clear data ownership clauses — nonnegotiable for franchisors consolidating customer data.
  • Mobile & offline capability: mobile franchise software features that keep sales and service functioning when connectivity is poor or field staff are on the go.

Practical trade-off: choosing an all-in-one franchise management system will simplify vendor management but usually forces compromises in best-of-breed functionality. If local messaging and lead handling are mission critical, pair a specialist messaging stack with your franchise management system rather than over-customizing one platform.

Integration nuance: prioritize data models and unique identifiers during vendor selection. If leads or customers can’t be reliably deduplicated between POS, CRM, and scheduling, your analytics and loyalty programs lie. Demand sample data mappings from vendors and test with real records during the pilot.

Concrete example: A 25-location fitness brand used a cloud-based franchise software CRM plus a messaging-focused platform for lead distribution. Online leads were captured, assigned to the nearest trainer within 2 minutes, and tracked back into the CRM; conversion rose because response time dropped and regional managers could see which messaging sequences worked. 

What teams should prioritize first: if customer acquisition is your bottleneck, lock in lead capture/distribution and CRM deduplication. If royalties and compliance are chaotic, prioritize accounting integrations and reporting rollups. You cannot optimize both effectively without sequencing the rollout.

Key takeaway: prioritize Centralized CRM, Lead Distribution with SLA enforcement, Reporting rollups, and prebuilt POS/accounting integrations. These four reduce duplicate work, speed conversions, improve royalty accuracy, and give leadership actionable visibility.

Business benefits with real operational metrics and examples

Real change shows up in minutes, not reports. The clearest, fastest ROI from franchise software comes from reducing lead response time, standardizing reporting, and cutting manual admin for royalties and marketing. Expect measurable gains inside the first 3 to 6 months if you prioritize the right modules and run a proper pilot.

Key operational metrics and realistic targets

  • Lead response time: target reduction from 24-72 hours down to under 1 hour for inbound leads. Faster responses commonly lift conversion by 20 to 40 percent when combined with automated follow up.
  • Lead to sale conversion rate: an uplift of 15 to 35 percent is realistic when lead distribution SLAs and messaging automation are enforced.
  • Administrative hours per location: expect a 30 to 60 percent reduction in weekly hours spent on reporting, royalty reconciliation, and manual campaign deployment after integrations with POS and accounting.
  • Royalty/fee accuracy: move from error-prone manual spreadsheets to automated calculations and reconciliations to reduce disputes by 50 to 90 percent.
  • Customer retention and LTV: automated reengagement flows and centralized CRM typically increase 12-month retention 5 to 15 percent, lifting lifetime value materially over 12 to 24 months.

Tradeoff to plan for: best-of-breed franchise software components such as messaging and lead management deliver faster business impact but require reliable integrations and governance. Full-suite franchise management systems reduce integration work but cost more up front and slow time to value. Choose based on your integration capability and how quickly you need the metrics to move.

Concrete example: A 45-location boutique fitness network implemented a messaging and lead distribution layer and integrated it with their POS and franchise CRM. Lead response time fell from roughly 36 hours to 10 minutes, lead to sale conversion climbed 28 percent, and franchise reporting time per week dropped from 10 hours to 3 hours per location. The brand used the messaging layer as a front end while retaining its existing accounting stack.

MetricBeforeAfter (typical pilot)
Average lead response time36 hours10 minutes
Lead to sale conversion6%7.7% (+28%)
Admin hours per location per week10 hours3 hours
Royalty reconciliation disputesMonthly disputesQuarterly minor reconciliations

Key takeaway: If you can only measure two things during a pilot, measure lead response time and royalty accuracy. Those move revenue and reduce friction between franchisor and franchisee.

Practical next step: run a 3 to 5 location pilot that tracks the metrics above, include a baseline period, and test both automation rules and integrations.

Implementation checklist and phased rollout plan

Reality check: most failures happen during rollout, not purchase. A tight checklist and a staged rollout remove risk and create measurable momentum across corporate, regionals, and franchisees.

Preselection and contract checklist

  1. Stakeholder alignment: Confirm executive sponsor, regional owners, IT lead, and a small group of franchisee champions.
  2. Define success metrics: Pick 3 primary KPIs (for example lead response time, lead-to-sale conversion, and weekly active users) and methods for measurement.
  3. Data audit: Inventory customer, lead, and financial data sources; note formats (___CODE0, CODE1___, export limitations).
  4. Must-have integrations: Prioritize POS, accounting (QuickBooks/Xero), scheduling, and SMS/email channels.
  5. Security & data ownership: Require data export rights, role-based access, and an incident response SLA.
  6. Contract terms: Ask for pilot pricing, integration credits, and staged payments tied to milestones.

Pilot stage: scope, timeframe, and success criteria

Pilot scope: Run 3 to 5 representative locations for 8 to 12 weeks — include one high-volume site, one low-volume site, and one atypical market. Keep the pilot limited: core CRM + lead routing + messaging automation before broader integrations.

  • Define acceptance criteria: exact targets for each KPI and acceptable data sync error rates.
  • Data migration plan: Migrate a subset of records first; validate with sampling and reconciliation rules.
  • Support model: Vendor provides a dedicated onboarding manager and weekly status calls during the pilot.

Trade-off to accept: Integrating everything at once looks efficient but increases failure modes. Staged integrations cost time up front but reduce rollback risk and keep franchisees engaged.

Scale: integrations, training, and governance

  1. Integration order: Connect POS and CRM first (customer and transaction data), then accounting, then scheduling and marketing channels.
  2. Training model: Use train-the-trainer, role-based sessions, short video snippets, and an in-app help center. Schedule refresher sessions at 30 and 90 days.
  3. Governance: Create a steering committee, define data owners, and set a change-control process for templates, automations, and local marketing permissions.

Practical limitation: Franchisees vary in tech adoption. Expect ~10–20% of locations to need extra hand-holding; budget for field visits or paid onboarding credits rather than assuming remote training will be enough.

Concrete example: A regional fitness brand ran a pilot using a messaging-focused layer to manage inbound leads at four clubs. They enforced a 30-minute SLA, trained staff with two 60-minute sessions, and measured conversion lift and response time weekly — the pilot identified a single data mapping bug that, once fixed, removed 40% of duplicate leads during full rollout.

Key takeaway: Lock a short pilot with clear KPIs, require vendor support and integration credits in the contract, and stage integrations to protect franchisee operations.

If you want practical templates, use an RFP that includes integration mapping and SLA requirements, and review vendor responsiveness during the pilot.

Best franchise software solutions and where each fits

Direct point: Vendors fall into three practical buckets – full lifecycle suites, midmarket operations platforms, and best-of-breed specialty tools – and your choice should map to the single problem you need solved first, not the vendor logo. Scale and integration capability are the filters that expose which bucket you belong in.

VendorBest fitStrengthsLimitations
FranConnectEnterprise franchisors 250+ locationsComprehensive franchise lifecycle features – onboarding, compliance, reporting, franchise salesHigher cost, longer implementation, can be heavy to customize
NarangaMidmarket brands 50-250 locationsStrong operations, onboarding, and compliance workflowsLess flexible for highly unique workflows or deep CRM customizations
FranchiseSoftSmall to midmarket under 100 locationsAffordable franchise management and CRM basicsSimpler reporting and fewer integrations out of the box
FranchiseBlastBrands prioritizing royalty accuracy and auditFocused financial reconciliation and royalty reportingNarrow scope – needs integrations for engagement and CRM
SalesforceEnterprise needing deep CRM customizationUnlimited customization, advanced reporting, enterprise integrationsHigh implementation cost, requires consultants and governance
GleantapMulti-location brands prioritizing messaging and lead managementFast lead distribution, messaging automation, multi-location engagementNot a full franchise accounting or royalty system – pairs best with an ops suite

Tradeoffs that matter in real deployments

Integration tradeoff: Choosing a suite reduces the number of integrations you manage but increases vendor lock and setup time. Choosing best-of-breed reduces lock and lets you pick best functionality per domain, but you must own the data model and identity of truth – that is where projects fail in year two.

  • When to pick a suite: You have complex franchise sales, strict compliance, and need consolidated onboarding and royalties across countries.
  • When to pick best-of-breed: Your primary pain is customer engagement or lead response and you already have accounting and POS systems you trust.
  • Must-check integrations: POS, accounting, scheduling, SMS/email, single sign on – if the vendor lacks a reliable API expect costly middleware work

Concrete example: A 120-location fast casual chain used FranConnect for franchise onboarding and royalty rollups while deploying Gleantap for lead distribution and SMS campaigns. The result was clearer financial reconciliation at corporate and a measurable drop in lead response time at store level, because messaging responsibilities rested with a specialist tool rather than shoehorning communications into the ops suite.

If you must choose one area to prioritize first, pick customer data and lead distribution. Even robust royalty reporting is ineffective if you cannot respond to or convert leads consistently at the local level.

Judgment call: For 50 to 200 locations I usually recommend a modular approach – a midmarket ops platform plus a dedicated engagement layer – because it balances cost, speed, and control. For more than 250 locations or heavily regulated franchises, bite the complexity of an end-to-end suite or an enterprise CRM like Salesforce, but budget heavily for implementation and governance.

Next consideration – map the vendor fit to the problem you will measure in the first 90 days. Pick the tool that moves that needle fastest, not the tool with the most features.

Pricing, total cost of ownership, and sample ROI worksheet

Start with a hard number: most franchisors underbudget implementation and integration by 25–40%. Budgeting license fees alone is a dead end — TCO for franchise software is dominated by integrations, data cleanup, change management, and the first 12 months of support. If you skip those, you will miss the true payback timeline.

What to include in your three-year TCO

  • Direct licensing: per location or per user fees and any tiered feature costs
  • Implementation & integrations: mapping, API work, POS/accounting connectors, and middleware
  • Data migration & cleanup: the hidden hours to consolidate customer and transaction histories
  • Training & change management: initial sessions, role-based materials, and follow-up coaching
  • Ongoing support & maintenance: SLA levels, premium support, and upgrade costs
  • Hardware or terminals: if on-prem components or kiosks are required
  • Opportunity costs / soft savings: reduced admin hours, faster lead response, higher conversion, lower churn

Practical tradeoff: buying a single-suite enterprise franchise management system reduces integration scope but raises license and customization costs. Choosing best-of-breed pieces like a messaging-first tool plus a franchise accounting connector keeps per-seat fees lower but increases integration and governance effort. Pick the path that matches your in-house integration capacity and how fast you need value.

Sample ROI worksheet (3-year view)

Line itemYear 1Year 2Year 3
License & hosting$60,000$60,000$60,000
Implementation & integrations$75,000$10,000$10,000
Data migration & cleanup$20,000$0$0
Training & change management$15,000$5,000$5,000
Annual support & maintenance$12,000$12,000$12,000
Hardware / terminals$8,000$2,000$2,000
Total costs$190,000$89,000$89,000
Saved admin hours (value)$45,000$60,000$60,000
Net new revenue (conversion + retention)$120,000$180,000$200,000
Net benefit (revenue + savings – costs)$-25,000$151,000$171,000
Cumulative ROI-13%69%151%

Concrete example: a 75-location fitness brand with average monthly revenue per location of $25,000 invested in cloud-based franchise software plus a messaging layer. Year 1 includes heavy integration to POS and scheduling and shows a small net loss while conversion and reengagement automation are fine-tuned. By Year 2 faster lead response and automated reengagement flow deliver measurable revenue lift and cover the initial investment — this mirrors real rollouts where Year 1 is stabilizing, Year 2 is scaling.

  1. How to use this worksheet: plug your license quote, one-time implementation estimate, and conservative revenue lift (start with 5–10% conversion improvement) then model payback months.
  2. Negotiation levers: ask vendors for pilot discounts, integration credits, and staged payments tied to success criteria. Vendors expect negotiation on integration scope — be explicit about which POS/accounting integrations are critical.
  3. Measurement guardrails: require the vendor to support exportable reports for lead response time, conversion, and royalty accuracy during the pilot (evaluate support responsiveness during this period).

Key takeaway: treat Year 1 as an operational investment with modest net benefit; real ROI usually arrives in Year 2 once integrations, training, and automated campaigns reliably reduce lead response time and administrative load.

Common implementation pitfalls and how to avoid them

Direct observation: implementation failures rarely come from the software itself; they come from mismatched expectations, incomplete processes, and unresolved operational edge cases. Address those first and the technology will follow.

Top implementation pitfalls and practical fixes

  • Poor data mapping and hidden quality issues: migrating customer and location data without validating identifiers, address formats, or franchisee ownership history causes royalty and reporting errors. Fix: run a scoped data audit, map keys (location ID, tax IDs) and reconcile a sample set before full migration.
  • Faulty lead routing and SLA gaps: ambiguous routing rules or lack of SLA enforcement turns leads into noise. Fix: implement deterministic routing, fallback rules, and automated SLA alerts tied to conversion KPIs.
  • Neglecting local workflows and mobile UX: corporate desktop demos look fine until franchisees try tasks on a phone during peak service hours. Fix: test on real devices and include the busiest franchisees in usability tests.
  • Early overcustomization: customizing workflows for a handful of locations creates upgrade blockers and long-term maintenance debt. Fix: lock a set of core templates and allow limited, versioned local overrides.
  • Underestimating integration effort and costs: vendors promise APIs but actual mapping to POS, scheduling, and accounting is work. Fix: secure integration scoping and credits in the contract and require sandbox access for end-to-end tests.
  • No clear data ownership or rollback plan: without exportable data and documented ownership, you’re stuck if you change vendors. Fix: contract explicit data export formats and a rollback timeline into the SOW.
  • Low franchisee adoption: lack of incentives or visible value means the platform sits unused. Fix: attach a simple KPI to compensation or marketing funds and publicize quick wins to peers.

Concrete example: a 75-location fitness brand routed new leads to a central inbox without SLA rules. Local clubs saw fewer qualified tours and conversions dropped 30% in two months. After implementing deterministic routing, SLA timers, and local fallback routing, response time dropped under 1 hour and conversions recovered within six weeks.

Practical trade-off: moving fast reduces time-to-value but increases rework risk. Spend 10–20% of project time on verification (data samples, routing tests, mobile UX) to avoid 3x rework later.

Key takeaway: require sandbox environments, exportable data, and measurable acceptance criteria in the contract; those three items prevent 60–80% of vendor-related implementation headaches.

Judgment call: choose a vendor that supports iterative deployment and rollback rather than a single big-bang flip. If you must go big-bang, budget double for QA and have finance and franchisee leads sign off on acceptance gates. For vendor comparisons and categories, see G2 and vendor lifecycle guidance on FranConnect.

Frequently Asked Questions

Short answer: The questions you ask vendors should separate marketing polish from operational reality — focus on data ownership, integration points, and measurable pilot KPIs rather than feature checklists.

Practical FAQs operations teams actually need answered

  • How is franchise software different from a standard CRM: Franchise systems are multi-tenant by design: they provide franchisee portals, hierarchical permissions, royalty and fee reporting, and rollup dashboards that a standard CRM does not deliver out of the box.
  • Can I use Gleantap as my primary franchise platform: Gleantap is purpose-built for messaging automation and lead management; it works well as the customer engagement layer and can integrate with full franchise management suites for accounting and compliance.
  • What KPIs should a pilot prove: Track lead response time, lead-to-sale conversion, weekly active franchisee users, and hours saved on manual reporting. Target reductions: lead response under 1 hour and a conversion lift in the 10-20% range are realistic benchmarks for engagement-focused pilots.
  • How long will a rollout take and what cadence works: Expect 3 to 9 months. Run a 6- to 12-week pilot (3–5 representative sites), then a 60–120 day phased regional rollout with predefined success gates for integrations and adoption.
  • Which integrations are nonnegotiable: POS, accounting (QuickBooks/Xero), scheduling/booking, and SMS/email channels. Confirm real-time syncing capabilities and whether the vendor supports webhooks or prebuilt connectors.
  • Who owns the data and how portable is it: Demand contractual clarity on data ownership and a documented export process. Vendors that gate exports or charge for raw data dumps create real migration risk and increase TCO.
  • What is the customization tradeoff: Customizing workflows or UI speeds initial adoption but slows vendor upgrades and increases support costs. Prioritize configurable templates and preserve minimal custom code to avoid long-term lock-in.
  • Do I need offline or mobile-first features: If franchisees operate in areas with intermittent connectivity, pick a solution with mobile-first UX and offline caching for critical actions (lead capture, payments) — otherwise adoption collapses in day-to-day use.

Concrete Example: A 40-location regional fitness brand ran a 10-week pilot that layered a messaging-first tool onto their existing scheduling and POS. They reduced average lead response time from ~24 hours to ~45 minutes and reported a 12% lift in trial conversions; that pilot also exposed two missing POS fields the vendor had to add for proper revenue attribution.

Practical judgment: Best-of-breed solutions win when you have clear integration standards and internal ownership for the data model; if your IT resources are limited and you need one vendor responsible for everything, pick a suite and accept slower innovation but simpler governance.

Pilot KPI checklist: Lead response <1 hour | Lead-to-sale +10–20% | Weekly active franchisee users >70% | Reporting time per location reduced by 30%.

  1. Run three focused vendor demos using the same ops scenarios (lead routing, royalty report, POS exception).
  2. Negotiate a 90-day pilot with clear success metrics and a documented data export clause before signing long-term.
  3. Require a technical runbook from the vendor showing APIs, webhook behavior, and sample data mappings for your POS/accounting systems.

Customer Loyalty: What It Is, Strategies, Tools & Real Business Impact

If acquisition costs are climbing and repeat behavior is inconsistent, this guide turns customer loyalty from a marketing slogan into a measurable growth lever. You will get a practical playbook for designing loyalty programs, where to apply loyalty & Gamification so it actually moves the needle, the tooling patterns (including Gleantap for messaging and automation), and exact ways to measure lift using Retention Rate and CLV. Expect cohort tests, ROI formulas, and a 30–90 day checklist you can run with limited engineering resources.

1. Why customer loyalty matters for growth

Retention rate drives economics. Small improvements in retention change customer lifetime value and CAC payback more than equivalent cuts in acquisition cost. Treat customer loyalty as a lever for unit economics, not a marketing vanity metric like program enrollments or social followers.

Retention math made concrete

Simple formula to use every time: CLV ≈ ARPU / churn_rate when churn is measured for the same period as ARPU. Use cohort-based churn for accuracy. This makes the impact of a retention change immediate and measurable.

Worked example: A gym charges average revenue per user (ARPU) of $50 per month. If monthly churn is 6 percent, average lifetime is about 1 / 0.06 = 16.7 months and CLV ≈ $50 * 16.7 = $835. Lower churn to 5 percent and lifetime rises to 20 months, CLV ≈ $1,000. That 1 percentage point improvement in monthly churn increases CLV by ~20 percent and shortens CAC payback by four months if CAC is $200.

Practical tradeoff to watch. Loyalty programs raise retention but cost money and operational complexity. Rewarding price sensitive behavior with discounts can inflate short term frequency while compressing margin. Design rewards to reinforce profitable actions like higher spend per visit, referrals, or subscription upgrades rather than just lowering price.

How to use this in planning. Make retention rate the north star for loyalty initiatives and predict ROI by converting expected retention lift into incremental CLV and payback months. Run a holdout test and report cohort retention delta at month 1 and month 3 before rolling out rewards broadly.

Concrete example: A mid sized boutique gym launched a tiered rewards pilot that combined a 30 day visit streak badge and a referral credit. After a 60 day pilot with a 20 percent member holdout, the pilot group showed a 3 percentage point higher month to month retention and 12 percent higher spend from referral credits being used on add ons. The business used those cohort numbers to justify expanding the program and automating flows in Gleantap to reduce manual work.

  • Measure what matters: Track cohort retention, revenue per active customer, and CAC payback rather than member count.
  • Align rewards to margin: Prioritize rewards that increase visit frequency, AOV, or referrals over straight discounts.
  • Experiment before scale: Use randomized holdouts or geo tests to measure incremental retention lift and avoid assuming correlation is causation.

Key stat: A 5 percent improvement in retention can increase profits by 25 to 95 percent depending on industry mix. See Bain and the analysis summarized in HBR for industry context.

Takeaway: If your loyalty effort cannot produce a testable retention lift that converts to increased CLV and faster CAC payback, it is a tactical distraction. Next consideration is how to measure the lift reliably with cohorts and instrument messages so you can attribute improvements to the program.

2. Measuring loyalty and retention: metrics, formulas, and dashboards

Start here: if you want to prove a loyalty program, measure cohort retention not aggregate active users. Cohorts tell you whether the same customers keep returning — which is the behavior loyalty programs are meant to change.

Core formulas you will use

Retention rate (period): (Customers active in period t+n who were active in period t) / (Customers active in period t). Example: 1,000 members billed in January and 830 billed in April = 83% retention over 3 months. Churn rate: 1 – retention. Repeat purchase rate: customers with 2+ purchases / total customers in a period. Simplified CLV: Average order value purchase frequency per period average lifetime (periods) – acquisition cost. Use these consistently across cohorts.

Practical tradeoff: choose cohort granularity based on business rhythm – weekly cohorts for daily-transaction businesses, monthly for subscriptions and gyms. Smaller cohorts give faster signals but more noise; larger cohorts reduce noise but slow decision cycles.

Cohort analysis template and a SQL starter

What to capture: cohort_date, user_id, event_date (purchase or visit), revenue, channel, loyalty_status. Track month 0 through month 12 retention as a heatmap and export the raw cohort table for statistical testing.

SQL starter (BigQuery style): SELECT cohort_month, MONTH_DIFF(event_date, cohort_date) AS months_after, COUNT(DISTINCT user_id) AS active_users FROM events WHERE event_type IN (purchase,visit) GROUP BY cohort_month, months_after Use this to build a heatmap matrix of retention proportions.

  • Dashboard widgets to build: cohort heatmap (month 0-12), retention curve line for top acquisition channels, repeat purchase rate by cohort, revenue per active customer by cohort.
  • Segments to compare: loyalty members vs non-members, paid acquisition vs organic, top 20% spenders by cohort.
  • Alert rules: flag cohorts where month 1 retention drops by >5% vs prior cohort — investigate quickly.

Concrete example: A mid-market gym ran a 90 day pilot giving recurring-visit badges. Baseline cohort month 1 retention was 78%. After the pilot, the treated cohort showed 84% month 1 retention – an absolute lift of 6 percentage points. Translating that lift into CLV showed payback within 6 months because incremental visits increased membership add-ons and referrals.

Common blind spot: teams use before/after comparisons without a holdout. That overstates program impact. Always run a randomized holdout or geographic control when possible and measure incremental retention difference.

Key takeaway: focus on cohort retention and channel segmentation. Small retention lifts compound — as Bain shows, a few percentage points can swing profitability considerably. See Bain Company insights on loyalty and retention.

Next consideration: build the cohort table into your primary BI pipeline now so every loyalty test, gamification element, or membership change can be measured against the same baseline.

3. Loyalty program design that impacts retention

Key point: A loyalty program only impacts Retention Rate when its mechanics change actual customer behavior – not when it simply promises discounts. Design needs an explicit behavior-to-reward map, an economics check, and operational rules that keep redemption feasible.

Core components to design

  • Program model: Choose tiered, points, or membership and align to your revenue cadence and margins.
  • Target actions: Specify the exact behaviors you want to increase – visit frequency, spend per visit, referrals – and prioritize one or two to avoid diluting impact.
  • Reward economics: Calculate break even cost per incremental visit or transaction before launch.
  • Redemption UX: Keep redemption friction minimal – immediate, local, and trackable.
  • Data and measurement: Capture events that map to cohort retention and instrument a control group for experiments.
  • Fraud and expiry rules: Protect margins with sensible expiries and abuse detection.

Trade-off to accept: Simplicity wins operationally but can limit personalization. Complex tier rules or many earn paths increase perceived value for customers but also raise support load and implementation time. If you have limited engineering bandwidth, prefer a straightforward points-per-action model and add tiers later.

Practical break-even example

ActionRewardCost per actionAverage margin per actionNet per action
Gym visit10 points (redeemable for a $10 reward at 500 points)$0.20$8.00$7.80
Referral sign-up$25 credit$25.00$50.00$25.00

Concrete example: A midsize fitness studio gave 10 points per visit and 100 bonus points for a five-week streak, with 500 points = $10 credit. Using Gleantap for automated streak reminders and POS integration to record visits, the studio measured a 6 percent lift in month 2 retention among members who entered the streak funnel. Reward cost stayed within margin because average spend per visit was high and redemptions clustered on slow days.

Misunderstanding to avoid: Gamification is not the same as meaningful incentives. Progress bars and leaderboards increase engagement only when tied to measurable business outcomes such as higher visit frequency or referrals. Do not add gamified layers that customers enjoy but that do not move cohorts in your retention dashboard.

Implementation rule: Start with a single north-star behavior, run a 30 day pilot with a holdout, and measure cohort retention at month 1 and month 3 before expanding mechanics.

Design reminder: A small retention lift scales. Bain analysis shows a 5 percent retention increase can materially boost profits in many industries; build your break-even model with that leverage in mind. See Bain insights.

Next consideration: pick the primary retention metric your program will move, wire the event schema into analytics and Gleantap, and schedule a controlled pilot with a clear break-even calculation.

4. Where gamification belongs and how to apply it

Practical rule: use gamification only when it maps directly to a measurable retention or frequency behavior. If the mechanic does not change visit cadence, repeat purchase, or membership renewal it is decoration — pretty, distracting, and expensive.

When gamification is the right tool

  • Behavior is repeatable and observable: customers take the same action regularly (visits, orders, workouts) so you can measure frequency changes.
  • Short feedback loop: the reward or progress update happens soon after the action so the user sees cause and effect.
  • Low redemption friction: customers can claim rewards without handoffs or long waits — otherwise the mechanic becomes a barrier.
  • You can A/B test it: you can build holdouts (geo, cohort, or randomized) and measure Retention Rate and repeat purchase lift.

Useful gamification patterns and what they signal

  • Progression bars (progress to next tier): signals that nudges customers to close the gap — effective for increasing visit frequency but weak if the gap is unrealistic.
  • Streaks: build habit formation; best for daily/weekly actions. Risk: streak fatigue if rewards are too small.
  • Missions or short challenges: good for re-engagement windows (7–30 day missions) and measurable with cohort retention.
  • Social proof and leaderboards: drives community and advocacy in competitive categories (fitness, gaming); excludes casual users and can backfire if leaderboard leaders are unreachable.
  • Tiered status: increases spend/AOV when tiers have clear, attainable benefits; costs escalate if benefits are too generous.

Trade-off to accept: gamification increases engineering and product complexity. Each mechanic requires event tracking, state management, customer messaging, and fraud controls — plan for maintenance, not just launch.

Implementation checklist (practical steps)

  1. Map actions to business outcomes: pick 1–2 behaviors (visit frequency, referral, AOV) and define the retention metric you expect to move.
  2. Choose the simplest mechanic that can move that metric: start with a progress bar or a 14-day streak before adding leaderboards.
  3. Instrument events and identity: capture events in your analytics and stitch identity to CRM/pos so you can measure cohort Retention Rate lift.
  4. Automate messaging for nudges and redemptions: use messaging to surface progress and reduce redemption friction — see content=null&utmsource=null&utmcampaign=null&utmmedium=null target=_blank>Maximizing Customer Loyalty for examples.
  5. Run a controlled experiment: use a randomized holdout and measure month 1 and month 3 retention cohorts before full rollout.

Concrete example: A boutique gym implemented a 21-day visit streak with a visible progress bar and automated SMS nudges for members who missed two scheduled sessions. The stack used the membership system to emit visit events, Gleantap for SMS triggers, and cohort analysis to compare a holdout group; the program increased 30-day retention in the test cohort and paid for its small reward budget within six weeks.

Misunderstanding to avoid: teams assume gamification equals engagement. In practice it often raises superficial metrics (app opens, badge counts) without moving Retention Rate or CLV. Design for the business outcome, not the badge.

Key judgment: prefer short, measurable mechanics tied to a single retention KPI. Expand complexity only after proven lift.

Hard fact: a small percentage lift in retention scales dramatically — even a 5% improvement can materially change LTV and payback. See Bain for the underlying economics: Bain Company insights on loyalty and retention.

5. Tools and integration patterns for loyalty and retention

Start with events and identity, not features. Your stack should be designed around a clean event schema and deterministic identity stitching so rewards, messaging, and analytics all reference the same customer record. Without that, points get lost, messages appear off, and cohort-based Retention Rate calculations are meaningless.

Core integration patterns

  • CDP-first pattern: Capture all client and server events into a CDP (Segment, Rudderstack) then fan out to analytics (Snowflake/Looker), loyalty engine (Smile.io, LoyaltyLion, Annex Cloud), and messaging (Gleantap or Klaviyo). Best when you need unified identity and analytics.
  • Event-driven, real-time pattern: Checkout or visit triggers a server-side event to a loyalty engine API and returns updated balance instantly; a webhook notifies your messaging layer to send a receipt or reward. Use this when immediate feedback (stars, points) affects on-site behavior.
  • Batch-sync pattern for legacy POS/membership systems: Export daily transactions to a middleware (Airbyte / ETL) that writes to your loyalty ledger and analytics. Lower engineering cost but expect up to 24-hour delay in reward state.
  • Middleware microservice pattern: Run a small, hosted service that handles idempotency, reconciliation, and mapping between POS, membership systems (Mindbody, Zen Planner), loyalty engine, and Gleantap. This reduces vendor coupling and eases future vendor swaps.

Identity stitching rules matter. Use a stable primary key (company customer_id), then fall back to phone and email. Persist device IDs and reconcile with periodic fuzzy-matching routines to avoid duplicate accounts — duplicates are where fraud and bad redemption rates hide.

Concrete Example: A mid-size gym uses ___CODE0 for memberships, CODE1 for points, CODE2 as the CDP, and CODE3___ for SMS automation. When a member checks in, Mindbody emits a server event to Segment; Segment forwards it to Smile.io to award points and triggers a webhook to Gleantap to send a streak reminder. Analytics in Snowflake shows the cohort Retention Rate lift at day 30 and 90.

Trade-offs and limitations you must decide on. Real-time integrations give better customer experience but require engineering time and robust idempotency controls; batch syncs are cheaper but blur the impact timing of loyalty mechanics on visit frequency. Vendor-managed loyalty engines speed time-to-value but can limit custom gamification and create data export friction.

Operational pitfalls to watch for. Offline POS reconciliation, simultaneous redemptions, and gift-card style semantics create race conditions. Require idempotent APIs on your middleware, add server-side checks in the loyalty engine, and log all state changes for auditability so your Retention Rate and redemption KPIs are trustworthy.

Quick vendor checklist: API-first + webhook support; raw event export to warehouse; SDKs for web/mobile; offline import and reconciliation; SLAs for webhooks; pricing aligned to your metric (transactions vs MAUs). Start with an MVP: messaging + points ledger + cohort dashboard before adding tiers or complex missions. See the Gleantap partner program for implementation help: content=null&utmsource=null&utmcampaign=null&utmmedium=null target=_blank>How to Become a Partner – Gleantap.

Implement the cheapest integration that proves retention lift. If it moves Retention Rate at a cohort level, invest in real-time polish next.

6. Measuring incremental impact and calculating ROI

Start with a clean counterfactual. The only defensible claim about a loyalty program is the incremental change versus what would have happened without it. That means a randomized holdout or a comparable geo holdout, predefined primary metric, and a measurement window long enough to capture delayed effects on repeat customers and churn.

Experiment design essentials

Design rules. Use randomized assignment when you can. If engineering or UX constraints prevent randomization, use geo holdouts or time-based rollouts with matched cohorts. Pre-register the test window, primary metric (retention_rate by cohort at month 1, month 3, month 6), sample size, and success threshold so you avoid post hoc reasoning.

  • Primary metric first: Choose a retention definition that maps to value for your business – active membership for gyms, repeat purchase within 90 days for retail. Use cohort retention curves rather than single-point snapshots.
  • Power and sample size: If baseline month-to-month retention is 60 percent and you want to detect a 4 percentage point lift with 80 percent power and 5 percent alpha, expect to need several hundred customers per arm. Use a sample size calculator rather than eyeballing.
  • Intermediate signals: Track engagement events that should move first – open rates, mission completions, redemption rate. They are useful diagnostics but not substitutes for the primary retention outcome.
  • Duration and contamination: Run long enough to see sustained effects and watch for cross-over where holdout customers get exposed through referrals or marketing.

Converting retention lift to CLV and profit

Step by step conversion. Convert absolute retention lift into incremental customers, then multiply by expected future revenue per customer and margin to get incremental gross profit. Subtract program cost and compute ROI and payback period. Use conservative assumptions for remaining lifetime and margin to avoid overclaiming impact.

MetricValueExplanation
Treated customers1,000Customers in the loyalty pilot arm
Absolute retention lift at month 34 percentTreated retention 64 percent vs control 60 percent
Incremental retained customers401,000 * 0.04
Avg monthly revenue per customer$50Revenue averaged over recent cohort
Gross margin50 percentContribution margin on incremental sales
Expected remaining months10Conservative estimate based on churn analysis
Incremental gross profit$10,00040 $50 10 * 0.5
Program cost$2,500Rewards, tooling, agency or engineering
Net incremental profit$7,500Incremental gross profit minus program cost
Payback period2.5 monthsProgram cost / (incremental gross profit / expected months)

Concrete example: A boutique gym runs a 1,000-member pilot with a tiered streak reward. After 90 days the pilot arm shows a 4 percent absolute lift in active membership versus holdout. Using average monthly dues of $50 and 50 percent margin, the gym converts that lift into $10,000 incremental gross profit and recovers program cost in under three months. For a small business this is fast, measurable payback and justifies scaling.

Practical tradeoffs and limits. Short tests favor detectability but miss long tail effects like lifetime loyalty or advocacy. Larger, longer tests cost time and capital. Be skeptical of small absolute lifts reported without confidence intervals or without accounting for cannibalization where rewards simply shift timing of purchases rather than creating net new revenue.

Attribution pitfalls to watch for. Redemption cannibalization, selection bias from voluntary enrollment, and concurrent marketing campaigns are the usual offenders. Use intent-to-treat analysis to avoid overstating effects, and run sensitivity checks that subtract estimated cannibalized revenue.

  1. Report what matters: retention by cohort with confidence intervals, incremental revenue per retained customer, redemption rate, program cost per incremental retained customer, CLV uplift, and payback period.
  2. Automate the dashboard: push cohort tables and ROI calculations into your BI tool and use messaging platforms like content=null&utmsource=null&utmcampaign=null&utmmedium=null target=_blank>Gleantap for experiment targeting and operational tracking.
  3. Read the evidence: Ground your business case in sources such as Bain for retention economics and HBR for experience to value linkage.

Key takeaway: Run randomized holdouts where possible, convert absolute retention lift into incremental customers, and use conservative lifetime and margin assumptions. Program ROI must be reported as net incremental profit and payback period, not just higher engagement metrics.

7. Real world examples and a 90 day implementation roadmap

Direct observation: most loyalty pilots fail not because the idea is bad but because teams try to build the entire program at once. Start small, measure retention rate impact, then scale. Prioritize implementable mechanics that map to a single behavior you can measure.

Real examples that inform your roadmap

Concrete Example: A regional gym chain reduced 30 day churn by 18 percent using a two-pronged approach: automated SMS check-in nudges for members with zero visits in 14 days and a simple visit-streak reward that unlocked a free personal training session after four consecutive weeks. Implementation required no loyalty engine – just Gleantap for messaging, membership data from the POS, and a small webhook to flag streak completion.

Use case to copy: a boutique e-commerce brand launched a two-tier VIP program limited to repeat buyers. Tier benefits were operationally simple – free expedited shipping and early access – and the brand tracked increase in average order value and repeat purchase frequency rather than chasing vanity metrics like app opens.

Practical trade-off: prioritize speed-to-value over completeness. A 30 day MVP that changes one measurable behavior is far more informative than a 6 month build with unclear KPIs. The downside is you may need to refactor data models later – accept that cost and budget it into the 60 day work.

90 day implementation roadmap – clear owner roles and checkpoints

  1. Day 0-14 – Discovery and baseline: define your north star cohort and capture baseline retention rate, repeat purchase rate, and CLV for that cohort. Assign owners: marketing for creative, analytics for cohort queries, engineering for integrations.
  2. Day 15-30 – MVP build and small holdout: pick one high-impact mechanic – onboarding bonus, reengagement SMS, or referral credit. Implement messaging flows in Gleantap or your messaging tool, create a 10-20 percent randomized holdout for measurement, QA redeem flows, and soft-launch to 20 percent of target users.
  3. Day 31-60 – Measure and iterate: analyze early lift at day 7 and day 30 using cohort windows. Fix friction points in redemption and identity stitching. If reward economics look poor, lower reward cost or raise the behavior threshold. Prepare expanded engineering work for loyalty datastore if needed.
  4. Day 61-90 – Scale with guardrails: expand to full audience, add a second mechanic if justified (referrals or tiering), enable automations for lifecycle stages, and finalize fraud and expiry rules. Present retention lift, incremental CLV, and payback timeline to stakeholders.

Measurement note: always run a holdout. Observational before-after comparisons will mislead you when seasonality or marketing spend changes. Use the experiment frameworks in section 6 and report retention rate by cohort to prove causality.

CheckpointPrimary KPISuccess threshold
Day 30Month-1 retention for exposed cohort+3 to 5 percentage points vs holdout
Day 60Repeat purchase rate+5 to 10 percent relative lift
Day 90Incremental CLV and payback periodPositive incremental margin within 6-12 months

Key stat: a small retention uplift scales. Bain analysis shows a 5 percent retention increase can raise profits 25 to 95 percent depending on industry – use this when prioritizing budget. See Bain insights.

Operational warning: if your customer identity is fragmented across POS, CRM, and web, fix identity stitching before launching complex rewards. Bad data creates reward abuse, inaccurate retention measurement, and wasted spend.

Next consideration: after day 90, convert learnings into a prioritized backlog – data fixes first, then reward economics, then richer gamification. See the gym implementation guide for tactical messaging examples: content=null&utmsource=null&utmcampaign=null&utmmedium=null target=_blank>Your Complete Guide to Opening a Successful Gym Business.

Frequently Asked Questions

Quick orientation: These answers skip definitions and go straight to what you must decide, measure, and avoid when you run loyalty, gamification, and retention experiments.

  • Retention rate vs churn: Track retention as your north star. Churn is a useful diagnostic but not the operating metric for experiments because retention shows the positive change you can monetize.
  • When to use gamification: Use gamification when behavior has a measurable habit path (visit frequency, weekly workouts, recurring purchases). If you cannot link the mechanic to a concrete event you can track, stick to simple points and rewards.
  • Metrics to judge a 90 day pilot: Look for cohort retention at month 1 and month 3, repeat purchase frequency, and active member rate (customers who took a target action in the period). Also measure reward cost per incremental retained customer to check unit economics.
  • Minimum tech for an MVP: A messaging automation tool (___CODE0 or CODE1___), a simple points store (can be a dedicated loyalty engine or a tracked table), and one analytics table for cohort queries is sufficient.
  • Sample size and test duration: For a retention lift target of 2–3 percentage points, block randomize at the user level and run 8–12 weeks. If weekly activity is low, extend to 12 weeks. Underpowered tests generate false negatives more often than useful signals.

Practical tradeoff: Faster launches favor vendor solutions; custom mechanics favor building. Vendors reduce engineering time but constrain future product differentiation and add recurring costs and potential data reconciliation overhead.

Concrete example: A 1,800-member gym built a simple pilot: members were split into holdout and treatment. Treatment received automated SMS triggers for 7-day missed visits plus a 3-week visit streak challenge with a free guest pass at completion. After 90 days the team saw a 3 percent absolute lift in active members in the treatment cohort, which paid back the guest pass and messaging cost inside two months.

Attribution and common mistakes: Do not attribute all revenue lift to the loyalty mechanic. Control for promotional cadence, seasonality, and acquisition channel. Also watch enrollment vs engagement: high enrollment with low usage is a vanity metric.

Tactical threshold: For an MVP, aim for a 1–3 percentage point absolute monthly retention lift or a 5–10 percent relative lift. If you cannot detect that with your cohort sizes, either lengthen the test, raise treatment intensity, or reduce noise sources.

Next actions: 1) Pick one measurable behavior to change, 2) design a holdout test (8–12 weeks) with tracked events, 3) set a realistic retention lift target and reward cost ceiling, 4) instrument cohort dashboards and run the pilot.

The State of B2C Customer Engagement 2026

Why the next era of growth belongs to brands that turn customer data into real-time action

Executive Summary

B2C customer engagement is entering a new era.

For the last decade, most brands tried to win customers with better campaigns: more emails, more SMS messages, more automations, more loyalty programs, more dashboards, and more channels.

But the market has changed.

Customers now expect every interaction to feel timely, relevant, and connected. They expect brands to remember context, respond instantly, respect privacy, and make their experience easier—not noisier. At the same time, businesses are under pressure to grow with leaner teams, fragmented systems, rising acquisition costs, and customers who are quicker to leave after poor experiences.

The result is a major shift:

B2C engagement is moving from campaign management to autonomous revenue systems.

The winning brands will not simply send more messages. They will build systems that can identify customer intent, understand behavior, predict the next best action, and automatically engage customers across the right channel at the right moment.

This report explores six major shifts shaping B2C customer engagement in 2026:

  1. Customer loyalty is more fragile than companies think.
  2. Personalization is moving from “nice to have” to revenue infrastructure.
  3. AI is shifting from content generation to customer action.
  4. First-party data is becoming the foundation of customer engagement.
  5. Omnichannel is no longer about channel count—it is about continuity.
  6. Local and multi-location businesses need enterprise-grade engagement without enterprise complexity.

1. The customer loyalty gap is widening

Many companies believe they are doing a good job with loyalty. Customers disagree.

PwC’s 2025 Customer Experience Survey found that 70% of executives say customer expectations are evolving faster than their company can adapt, while 29% of consumers say they stopped using or buying from a brand due to poor customer experience, either online or in person. PwC also found that more than half of consumers stopped using or buying from a brand because of a bad experience with its products or services.

This is the first major warning sign for B2C brands: customer experience is no longer a soft metric. It is a revenue protection system.

Forrester’s 2025 Global Customer Experience Index tells a similar story. In the U.S., 25% of brands’ customer experience rankings declined in 2025, compared with only 7% that improved. Forrester also noted that CX quality declined across effectiveness, ease, and emotion in most U.S. industries.

That matters because most B2C businesses are fighting margin pressure from all sides:

  • Paid acquisition is expensive.
  • Labor is expensive.
  • Retention is harder.
  • Customers have more choices.
  • Switching costs are low.
  • Expectations are shaped by the best digital experiences, not just direct competitors.

For a gym, wellness studio, clinic, spa, amusement park, restaurant, or local service business, a poor experience may not look dramatic. It may simply look like:

  • A lead inquiry that sits unanswered overnight.
  • A missed follow-up after a trial class.
  • A member who stops attending and never gets re-engaged.
  • A failed payment that becomes a cancellation.
  • A customer complaint that goes unresolved.
  • A prospect who visits the pricing page but never gets contacted.
  • A review that receives no response.
  • A staff member who forgets to call a high-value lead.

These are small moments. But they compound into revenue leakage.

The new engagement reality

The old assumption was:

“If customers like us, they’ll stay.”

The new reality is:

“Customers stay when the experience keeps proving value.”

Loyalty is not a program. It is the cumulative result of every touchpoint.

That means B2C companies need to stop thinking of engagement as a marketing function alone. Engagement now spans sales, service, retention, operations, reviews, payments, loyalty, and customer support.


2. Personalization is now a growth engine, not a marketing tactic

Personalization used to mean adding a first name to an email.

That version of personalization is dead.

Today, customers expect brands to understand context:

  • What did I look at?
  • What did I ask about?
  • What location do I visit?
  • What have I purchased?
  • What class did I attend?
  • When was my last visit?
  • Am I at risk of churning?
  • Did I already speak with someone?
  • Am I a new lead, active customer, past customer, or VIP?

Twilio’s 2025 State of Customer Engagement Report says AI is creating a new era where customer experiences can become more personal, relevant, and connected—but it also notes that many consumers still feel like “just another number.” Twilio frames the opportunity as closing the gap between customer insight and customer action.

Salesforce’s State of Marketing report makes the same point from the marketer side. Salesforce surveyed nearly 4,500 marketers worldwide and reported that 83% of marketers recognize the shift toward personalized, two-way messaging, but only one in four are satisfied with how they use data to power those moments.

That is the personalization gap.

Most brands have more data than ever, but they still struggle to use it in real time.

Why personalization fails

Personalization fails when data is trapped in disconnected systems:

  • POS data lives in one place.
  • CRM data lives somewhere else.
  • Website behavior is separate.
  • Email and SMS engagement are separate.
  • Reviews are separate.
  • Staff notes are separate.
  • Membership data is separate.
  • Support conversations are separate.

The result is “personalized” communication that does not feel personal.

A customer cancels and still gets a renewal campaign.
A lead already booked a tour and still gets “book a tour” texts.
A high-value customer complains and still receives a generic promo.
A member at risk of churn receives a birthday coupon but no retention outreach.

That is not personalization. That is automation without intelligence.

The next stage: behavior-aware engagement

The next era of B2C personalization will be based on behavioral signals, not static segments.

Examples:

  • A pricing-page visitor receives a helpful follow-up within minutes.
  • A prospect who viewed class schedules gets a message about the best intro class.
  • A member who has not visited in 14 days gets a personalized check-in.
  • A customer with a failed payment gets a recovery message before collections.
  • A lead who asked about family plans gets routed into the right offer.
  • A customer who leaves a positive review gets a referral prompt.
  • A customer who leaves a negative review gets escalated to a manager.

This is where engagement becomes a revenue system.


3. AI is shifting from content generation to customer action

The first wave of AI in marketing was mostly about productivity: write this email, summarize this conversation, generate this ad, create this campaign.

That was useful, but limited.

The next wave is about action.

Gartner predicts that by 2029, agentic AI will autonomously resolve 80% of common customer service issues without human intervention, leading to a 30% reduction in operational costs. Gartner describes agentic AI as a shift from tools that merely generate text to systems that can take autonomous action to complete tasks.

McKinsey’s 2025 State of AI survey also shows that AI adoption is broadening, but most organizations are still early in scaling impact. McKinsey found that 88% of respondents report regular AI use in at least one business function, while roughly one-third say their companies have begun scaling AI programs. McKinsey also found that 23% of respondents report scaling agentic AI somewhere in the enterprise, while another 39% are experimenting with AI agents.

The message is clear: AI is no longer experimental, but value capture is still uneven.

Why most AI engagement efforts underperform

AI does not create business value simply because it exists.

It creates value when it is connected to:

  • Customer data
  • Business rules
  • Real-time triggers
  • Approved actions
  • Human escalation paths
  • Channel orchestration
  • Measurement loops

McKinsey’s research highlights that high-performing AI organizations are more likely to redesign workflows, define human validation processes, build technology and data infrastructure, and embed AI into business processes.

For B2C businesses, that means the question is not:

“Can AI write our campaigns?”

The better question is:

“Can AI help us identify who needs attention, decide what should happen next, and take action before revenue is lost?”

The rise of AI revenue agents

B2C companies will increasingly use AI agents for specific growth and retention jobs.

Examples:

Lead Response Agent

Responds instantly to new leads, answers questions, qualifies interest, and books appointments.

Website Visitor Agent

Identifies high-intent website visitors, tracks behavior, and triggers personalized outreach.

Failed Payment Recovery Agent

Detects failed payments, sends recovery messages, creates staff tasks, and escalates unresolved accounts.

At-Risk Customer Agent

Monitors behavior such as declining visits, inactivity, sentiment, or missed appointments and triggers retention outreach.

Review Response Agent

Responds to reviews, escalates negative feedback, and prompts happy customers for referrals.

Class or Event Fill Agent

Identifies underfilled classes, events, or appointment slots and engages the right audience.

Referral Generation Agent

Finds happy, engaged customers and prompts them to invite friends at the right moment.

This is the move from automation to autonomy.

Automation follows rules.
Autonomy uses context to decide the next best action.


4. First-party data is becoming the foundation of engagement

Privacy changes, platform restrictions, and consumer expectations are pushing brands away from rented data and toward direct customer relationships.

Deloitte lists first-party data as one of the major marketing trends shaping the immediate future, recommending that brands transform privacy into opportunity by using privacy-friendly data strategies to build trust and customer loyalty. Deloitte also highlights omnichannel experiences, automation, generative AI, and hyper-personalized experiences at scale as major trends.

Qualtrics XM Institute’s 2025 research on privacy and personalization, based on more than 23,000 consumers globally, found that consumers want personalization but remain highly concerned about data privacy. The report also notes that purchase history and site visits are among the top candidates for personalization, and that trust in data practices corresponds to comfort with data usage.

This creates a clear mandate:

Customers will share data when they believe it improves the experience. They will punish brands that misuse it.

PwC reinforces this point: 53% of consumers say it is worth sharing personal information if it makes interacting with a brand smoother, but 93% say a brand would lose their trust if it mishandled that data.

The first-party data advantage

For B2C brands, first-party data includes:

  • Contact information
  • Membership status
  • Purchase history
  • Visit frequency
  • Website activity
  • Appointment history
  • Class attendance
  • Email/SMS engagement
  • Reviews and feedback
  • Support conversations
  • Lead source
  • Location preferences
  • Payment status
  • Customer lifecycle stage

The brands that win will not necessarily have the most data. They will have the most usable data.

The new data question

The old question was:

“Do we have the data?”

The new question is:

“Can we act on the data in time?”

A churn signal is useless if no one acts on it.
A pricing-page visit is useless if sales never follows up.
A failed payment signal is useless if it becomes a cancellation.
A customer complaint is useless if it never reaches the right person.

First-party data becomes valuable when it powers action.


5. Omnichannel is no longer about being everywhere

For years, “omnichannel” meant having multiple channels: email, SMS, chat, phone, social, web, app, and maybe push notifications.

But customers do not care how many channels a brand has.

They care whether the experience feels connected.

Deloitte defines the opportunity as creating unified experiences and one-to-one relationships by stitching together journeys across digital and physical interactions.

That phrase—digital and physical—is especially important for local and multi-location B2C businesses.

A fitness club, clinic, spa, or amusement park does not operate purely online. The customer journey moves between:

  • Website
  • Search
  • Ads
  • Reviews
  • Forms
  • Phone calls
  • Texts
  • Emails
  • Front desk
  • Sales team
  • In-person visit
  • Membership or purchase
  • Support
  • Retention
  • Referral

If those moments are disconnected, the customer feels the friction.

The broken omnichannel experience

A prospect fills out a form.
Then they call the business.
Then they visit the location.
Then they get a generic email.
Then a staff member texts them without knowing they already called.
Then they receive another promo that ignores their actual interest.

This is not omnichannel. It is multi-channel chaos.

The connected omnichannel experience

A prospect visits the pricing page.
The business identifies the visit as high intent.
The CRM checks whether they are a known lead.
The AI agent sees they previously asked about family membership.
The prospect gets a helpful SMS offering the right membership option.
If they reply, the AI answers questions or books a tour.
If they do not reply, a sales task is created.
If they book, the system suppresses redundant promotions.
If they show up, the staff has context.

That is omnichannel engagement.

The difference is not the number of tools.
The difference is continuity.


6. Small and mid-sized B2C businesses are ready for AI—but need simplicity

AI is no longer just an enterprise trend.

PayPal and Reimagine Main Street’s 2025 small business survey found that 25% of small businesses have already integrated AI into daily operations, while over 50% are exploring AI implementation. The same survey found that 66% of small business owners believe adopting AI is essential for staying competitive.

The U.S. Chamber of Commerce’s 2025 small business technology report found that 58% of small businesses self-identified as using generative AI, up from 40% in 2024 and 23% in 2023. It also found that 84% plan to increase their use of technology platforms.

JPMorganChase Institute’s 2026 research notes that small firms have historically adopted new technologies more slowly than larger counterparts because of barriers such as capital constraints, limited technical expertise, and integration costs. The report also notes that AI tools promise productivity gains, better decision-making, and competitive advantages through improved customer engagement.

This is the key tension for B2C companies:

They want AI.
They need AI.
But they cannot afford complex enterprise implementations.

What B2C businesses actually need

Most local and multi-location operators do not need another complicated dashboard.

They need systems that help them answer:

  • Who needs attention today?
  • Which leads are most likely to convert?
  • Which customers are at risk?
  • Which failed payments need follow-up?
  • Which reviews need a response?
  • Which campaigns are actually driving revenue?
  • Which locations are underperforming?
  • Which staff tasks need to happen now?
  • Which customers should receive which message?

The future of B2C engagement will belong to platforms that hide complexity behind intelligent action.


7. Industry spotlight: Fitness and wellness

Fitness is a strong example of how B2C engagement is changing.

The Health & Fitness Association’s 2025 Fitness Industry Benchmarking Report found that in 2024, the sector had median revenue growth of 9.9%, net membership growth of 5.5%, and a member retention rate of 66.4%.

That means the industry is growing—but retention still leaves significant room for improvement.

For fitness and wellness operators, customer engagement directly affects:

  • Lead conversion
  • Trial-to-member conversion
  • Visit frequency
  • Class attendance
  • Failed payment recovery
  • Upgrade opportunities
  • Referral generation
  • Review volume
  • Member retention
  • Lifetime value

The challenge is that the member journey is full of signals that often go unused.

A member attends three times in week one, then disappears.
A prospect asks about pricing, then never books.
A member visits the cancellation page.
A parent asks about kids’ classes.
A customer leaves a five-star review.
A member’s payment fails twice.
A former member clicks a reactivation offer.

Each of these moments should trigger action.

Most businesses still rely on staff to notice.
The next generation of businesses will rely on systems that never miss the signal.


8. The B2C engagement maturity model

To understand where the market is heading, it helps to break B2C engagement into five maturity stages.

Stage 1: Manual Engagement

The business relies on staff memory, spreadsheets, inboxes, and one-off campaigns.

Common symptoms:

  • Leads fall through the cracks.
  • Follow-up is inconsistent.
  • Customer data is scattered.
  • Staff manually tracks tasks.
  • Campaigns are generic.
  • Reporting is limited.

Business risk: Revenue leakage is high because action depends on human consistency.


Stage 2: Basic Automation

The business uses scheduled campaigns and simple triggers.

Common symptoms:

  • Welcome emails
  • Birthday messages
  • Basic nurture sequences
  • Simple SMS reminders
  • Generic win-back campaigns

Business risk: Automation improves consistency but lacks context. Customers may still receive irrelevant messages.


Stage 3: Segmented Engagement

The business uses customer segments based on lifecycle, behavior, or attributes.

Common symptoms:

  • New leads vs active customers
  • High-value customers
  • Inactive members
  • Past-due accounts
  • Former customers
  • Location-level targeting

Business risk: Segmentation improves relevance, but most action is still pre-planned rather than real time.


Stage 4: Predictive Engagement

The business uses data to anticipate customer needs and risks.

Common symptoms:

  • Churn risk scoring
  • Lead conversion scoring
  • Visit frequency alerts
  • Revenue opportunity detection
  • High-intent website visitor alerts
  • Location health analytics

Business risk: Insights are valuable, but only if teams act quickly.


Stage 5: Autonomous Engagement

The business uses AI agents and workflows to identify, decide, act, and learn.

Common symptoms:

  • AI responds to leads instantly.
  • AI identifies high-intent prospects.
  • AI routes conversations.
  • AI creates staff tasks.
  • AI recovers failed payments.
  • AI detects churn risk.
  • AI personalizes outreach.
  • AI escalates sensitive issues.
  • AI measures outcomes.

Business advantage: Engagement becomes always-on, context-aware, and revenue-focused.


9. The new operating model: System of Record + System of Action

Most B2C businesses already have systems of record.

Examples:

  • POS system
  • Billing system
  • CRM
  • Booking platform
  • Membership database
  • EHR/EMR for clinics
  • Ticketing or support system
  • Website analytics
  • Review platforms

These systems store what happened.

But storing data is not enough.

B2C brands now need a System of Action—a layer that turns data into engagement.

System of Record

The system of record answers:

  • Who is the customer?
  • What did they buy?
  • What is their status?
  • What location do they belong to?
  • What is their payment history?
  • What appointments or visits happened?

System of Action

The system of action answers:

  • What should happen next?
  • Who should we engage?
  • What should we say?
  • Which channel should we use?
  • Should AI handle it or should staff step in?
  • Did the action drive revenue?
  • What should we do differently next time?

This is the strategic gap in most B2C businesses.

They have the data.
They have the channels.
They have the staff.
But they lack the intelligence layer that connects everything.

That is where the category is moving.


10. The highest-impact engagement plays for 2026

Below are the plays B2C brands should prioritize in 2026.

Play 1: Instant lead response

Speed still matters.

When a prospect submits a form, asks a question, visits a high-intent page, or replies to an ad, the business should respond immediately.

The goal is not to “automate everything.” The goal is to prevent high-intent demand from going cold.

Recommended workflow:

  1. Capture the lead source and intent.
  2. Match the lead to existing CRM data.
  3. Trigger an immediate SMS or chat response.
  4. Let AI answer basic questions.
  5. Offer the next best conversion step.
  6. Create a staff task if the lead is high value or unresponsive.
  7. Suppress redundant campaigns once the lead books or converts.

Play 2: Website visitor identification and intent-based outreach

Website traffic is often treated as anonymous until a form is submitted.

That leaves revenue on the table.

For B2C businesses with high-intent pages—pricing, schedules, membership options, services, locations, booking, demo, or contact pages—visitor behavior can reveal buying intent.

Recommended workflow:

  1. Install a website tracking pixel.
  2. Identify known or matched visitors where permitted.
  3. Track page-level behavior.
  4. Score intent based on pages viewed and repeat visits.
  5. Trigger personalized outreach.
  6. Route high-intent prospects to sales or AI.
  7. Measure conversion from visit to conversation to purchase.

This is especially powerful for businesses where customers research before visiting in person.


Play 3: Failed payment recovery

Failed payments are not just billing issues. They are retention risks.

A failed payment can quickly become:

  • Lost revenue
  • Staff follow-up burden
  • Customer frustration
  • Membership cancellation
  • Collections activity

Recommended workflow:

  1. Detect failed payment immediately.
  2. Send a friendly recovery message.
  3. Include a direct payment update link.
  4. Follow up across SMS/email if unresolved.
  5. Create a staff task after a defined threshold.
  6. Pause outreach once payment is resolved.
  7. Track recovery rate and revenue saved.

Play 4: At-risk customer re-engagement

Most churn does not happen suddenly. It shows up as behavior change first.

Signals may include:

  • Declining visit frequency
  • Missed appointments
  • No class attendance
  • No recent purchases
  • Negative sentiment
  • Support complaints
  • Failed payments
  • Reduced email/SMS engagement
  • Cancellation page visits

Recommended workflow:

  1. Define risk signals by business type.
  2. Score customers based on recency, frequency, monetary value, and sentiment.
  3. Trigger personalized check-ins.
  4. Offer helpful next steps, not just discounts.
  5. Escalate high-value customers to staff.
  6. Track save rate, return visits, and retained revenue.

Play 5: Review response and reputation growth

Reviews are no longer just social proof. They are part of the customer engagement loop.

A review can signal:

  • A happy customer ready for referral
  • An unhappy customer who needs intervention
  • A location-level service issue
  • A staff performance opportunity
  • A product or experience gap

Recommended workflow:

  1. Monitor reviews across major platforms.
  2. Use AI to draft or publish brand-safe responses.
  3. Escalate negative reviews.
  4. Tag themes such as staff, cleanliness, pricing, billing, or experience.
  5. Trigger referral asks for happy customers.
  6. Feed insights into location performance dashboards.

Play 6: Location-level engagement intelligence

For multi-location businesses, the future is not just “how are campaigns performing?”

The better question is:

“Which locations are healthy, which are leaking revenue, and why?”

Location-level engagement should track:

  • Lead response time
  • Lead-to-visit conversion
  • Visit-to-purchase conversion
  • Member/customer retention
  • Review volume and sentiment
  • Failed payment recovery
  • Campaign engagement
  • Staff task completion
  • Revenue per customer
  • Customer lifecycle health

This lets leadership identify whether a location has a demand problem, conversion problem, retention problem, staffing problem, or experience problem.


11. Metrics that matter in the new era

B2C brands need to move beyond vanity metrics.

Open rates and click rates still matter, but they are not enough.

Revenue metrics

  • Revenue influenced by engagement
  • Revenue recovered from failed payments
  • Revenue from reactivated customers
  • Revenue from referrals
  • Revenue per customer
  • Customer lifetime value
  • Net revenue retention by location

Conversion metrics

  • Lead response time
  • Lead-to-conversation rate
  • Conversation-to-appointment rate
  • Appointment-to-purchase rate
  • Trial-to-member conversion
  • Website visitor-to-lead conversion
  • High-intent visitor conversion

Retention metrics

  • Churn rate
  • Save rate
  • Visit frequency
  • Inactive customer recovery
  • At-risk customer engagement
  • Retention by location
  • Retention by lifecycle stage

Experience metrics

  • Review rating
  • Review response time
  • Sentiment trend
  • Support response time
  • Complaint resolution rate
  • NPS or satisfaction score

Operational metrics

  • Staff task completion
  • AI resolution rate
  • Escalation rate
  • Campaign setup time
  • Automation coverage
  • Channel response time
  • Cost per retained customer

The best engagement teams will measure not just activity, but action and outcomes.


12. What this means for B2C leaders

For CEOs, CFOs, CMOs, and operators, the takeaway is simple:

Customer engagement is becoming a core revenue function.

It is no longer enough to buy a CRM, send newsletters, run ads, and hope staff follows up.

The new mandate is to build an engagement system that can:

  • Capture demand
  • Identify intent
  • Personalize communication
  • Respond instantly
  • Recover lost revenue
  • Prevent churn
  • Improve experience
  • Support staff
  • Measure business impact

This is especially important for local and multi-location businesses because execution inconsistency is one of the biggest growth killers.

A great campaign does not matter if one location follows up and another does not.
A great lead source does not matter if response time is slow.
A great customer experience does not matter if churn signals are ignored.
A great AI tool does not matter if it is disconnected from the business workflow.

The future belongs to brands that can turn every customer signal into the right action.


13. The Gleantap perspective: From campaigns to autonomous engagement

At Gleantap, we believe the next generation of B2C growth platforms will not be defined by who sends the most messages.

They will be defined by who helps businesses take the smartest actions.

That means moving beyond traditional marketing automation and toward an intelligent engagement layer that connects data, AI, communication, and operations.

For B2C businesses, the goal is not more software.

The goal is:

  • More leads converted
  • More customers retained
  • More payments recovered
  • More reviews generated
  • More conversations handled
  • More staff time saved
  • More revenue captured

The future of customer engagement is not another campaign calendar.

It is an always-on system that knows who needs attention, what should happen next, and how to take action before the opportunity is lost.


Conclusion: The new rule of B2C engagement

The old rule was:

Send the right message to the right person at the right time.

The new rule is:

Take the right action for the right customer at the right moment.

That distinction matters.

A message is only one possible action. Sometimes the right action is a text. Sometimes it is an email. Sometimes it is a phone call task. Sometimes it is a payment recovery workflow. Sometimes it is an AI conversation. Sometimes it is a manager escalation. Sometimes it is doing nothing because the customer already converted.

The future of B2C customer engagement will be won by brands that understand this difference.

Campaigns will not disappear.
Automation will not disappear.
Human teams will not disappear.

But the center of gravity is shifting.

The next era belongs to businesses that build intelligent, connected, AI-assisted engagement systems that turn customer data into revenue-producing action.

That is the state of B2C customer engagement in 2026.


Suggested SEO Title

The State of B2C Customer Engagement 2026: AI, Personalization, and the Shift from Campaigns to Autonomous Revenue Systems

Suggested Meta Description

Explore the major customer engagement trends shaping B2C businesses in 2026, including AI agents, personalization, first-party data, omnichannel engagement, and revenue automation.

Suggested Featured Image Concept

A premium illustration showing customer signals flowing from website, SMS, email, reviews, POS, and CRM into an AI-powered “System of Action” that triggers personalized outreach, staff tasks, and revenue recovery workflows.

Suggested Charts to Add

  1. The B2C Engagement Maturity Model
    Manual → Basic Automation → Segmented → Predictive → Autonomous
  2. System of Record vs System of Action
    POS/CRM/Billing stores data; Gleantap activates it.
  3. Revenue Leakage Map
    Missed leads, failed payments, inactive customers, poor reviews, slow follow-up.
  4. AI Agent Use Cases for B2C Businesses
    Lead Response, Website Visitor, Payment Recovery, Review Response, Retention, Referral.
  5. Metrics That Matter
    Activity metrics vs revenue metrics vs retention metrics.

The future of B2C growth will not be driven by brands that simply send more campaigns. It will belong to businesses that can turn customer signals into real-time action. Every missed lead, failed payment, ignored review, or inactive customer represents lost revenue hiding in plain sight. The opportunity in 2026 is not just to automate communication, but to build intelligent engagement systems that proactively convert, retain, and re-engage customers at scale. Brands that unify their data, activate AI-driven workflows, and create connected omnichannel experiences will outperform competitors still relying on disconnected tools and manual follow-up. The question is no longer whether customer engagement matters—it is whether your business can act fast enough to keep customers from leaving and revenue from slipping away.

Integrating Customer Service Automation with CRM Systems

If your support team feels buried under booking questions, payment issues, and routine requests, the right automation wired into your CRM can cut response times and lift resolution rates without turning customers into numbers. Customer Service Automation: What It Is, Use Cases, Tools & Real Business Impact explains how businesses streamline support while improving efficiency and customer experience. This guide shows how to plan, implement, and measure CRM customer service automation for B2C operations — with concrete integration patterns, data-model rules, pilot steps, and KPIs tailored to fitness clubs, wellness studios, retail, healthcare clinics, and family entertainment centers. Expect step-by-step recipes you can pilot in 6-8 weeks, plus the compliance and rollback controls needed to keep personalization and data quality intact.

Why integrate customer service automation with your CRM

Key point: CRM customer service automation is not about replacing agents, it is about making every automated touch carry CRM context so customers get correct, timely outcomes instead of generic replies.

What changes when you integrate: When automation can read membership status, last purchase, consent flags, and recent tickets from the CRM you stop building blind automations. That context lets you route high value customers to human agents, suppress unnecessary outreach, and surface the right KB article or form without a human in the loop.

Where the business value shows up

  • Faster correct responses: Automated replies that use CRM context reduce back and forth and fix simple cases in-channel.
  • Higher agent throughput: Agents spend less time on repetitive tasks and more time on complex issues that need judgement.
  • Better personalization at scale: Using CRM fields produces automated messages that read like human replies and preserve brand tone for members and VIPs.
  • Lower misrouting and escalations: Identity stitched across POS, booking, and CRM prevents duplicate tickets and erroneous closures.

Practical limitation: Real-time, bi-directional sync is ideal but costly to build and maintain. Native connectors give speed to deployment but often fail on edge cases like merged profiles or custom CRM objects. Plan for a hybrid approach where critical events are pushed in real time via webhooks and historical enrichment happens with periodic syncs.

Concrete example: A mid sized fitness chain wires automated waitlist messaging into its CRM so class openings only notify eligible members. The automation checks membership tier and recent attendance before sending the invite and auto-creates a ticket if the member replies with issues. That prevents false positives, reduces agent triage, and preserves the member experience.

Judgment call: Teams often over automate early. Start by automating read only actions and confirmations, not irreversible operations like refunds or membership cancellations. Include mandatory human handoffs for edge cases and surface the CRM record and rationale to the agent to speed resolution.

Quick checklist: Ensure a canonical customer ID exists, store consent flags in the CRM, map the small set of canonical fields automation needs, pick an integration pattern that matches engineering capacity, and instrument telemetry for containment and escalation rates.

Next consideration: If you need implementation details, examine connector options in your CRM ecosystem and read integration patterns from vendors and platforms like Gleantap Features, Zendesk, and Twilio before committing to a design.

Core integration patterns and when to use them

Core point: Pick the integration pattern to match the problem you need to solve, not the technology your team prefers. Prioritize how fresh the data must be, how many systems must participate, and who will own ongoing maintenance.

Pattern breakdown at a glance

PatternWhen to choose itTypical latencyMaintenance profileKey trade-off
Native connector (built-in CRM integrations)Small teams or simple use cases where the CRM already supports the channelNear real-time to minutesLow — vendor maintains the connectorFast to deploy but limited when you have custom objects or complex routing
API-first (REST/webhook bi-directional sync)Enterprises with custom CRM schema, strict identity needs, or high message volumeSub-second to secondsHigh — needs engineering and monitoringPowerful and precise but requires robust error handling and mapping logic
Middleware (Zapier, Make, integration platform)Rapid proofs-of-concept or teams with no engineering bandwidthSeconds to minutes depending on platformMedium — less code but connectors can break and scale poorlyEasy to build but often brittle at scale and for complex data transformations
Hybrid (batch enrichment + event-driven hooks)When historical data fuels decisions but live events drive conversationsEvents real-time, enrichment hourly/dailyMedium-high — requires orchestration and schema governanceGood balance, but you must manage two sync modes and reconcile conflicts

Practical insight: If your automations need customer context to decide routing or to suppress outreach (for example membership status or recent charge failures), treat the CRM as the system of record and surface only the minimal fields the automation platform needs. That reduces mapping drift and makes retries simpler when webhooks fail.

  • Low engineering capacity: Start with native connectors or middleware to validate the use case, but instrument production logs so you can see missed matches and edge cases.
  • High volume or compliance needs: Invest in API-driven syncs with idempotent endpoints and replayable event queues; cheap connectors will break under load and during audits.
  • Custom objects or loyalty tiers: Use API-first or hybrid. Connectors rarely understand bespoke membership business logic and will misroute or omit critical attributes.

Concrete example: A regional wellness studio used a webhook-driven API sync to enforce eligibility for discounted rebooking. The webhook carried the booking event to the automation layer which queried the CRM for membership tier and last visit; ineligible requests were blocked and a ticket created for manual review. This prevented incorrect discounts and cut manual verification time by more than half.

Judgment: Many teams over-index on low-cost quick wins and never switch to a durable integration. Budget for a staged migration: validate with connectors, then harden the top 3 flows with API-driven integration and monitoring.

Action checklist: map your critical events, pick the simplest pattern that meets latency and compliance needs, implement observability (event replay, DLQs), and plan a rollback where the automation can be paused without data loss.

For implementation references, review connector capabilities in your CRM and consider platforms purpose-built for B2C orchestration like Gleantap Features. If you plan conversational channels, check message delivery and webhook behavior against Twilio messaging docs before committing to a pattern.

Data model, identity stitching, and canonical fields

Hard truth: most automation failures trace back to bad identity work. If your automation platform and CRM do not agree on who a customer is and which fields are authoritative, automated routing, suppressions, and personalization will produce errors that look like bugs to customers and audits.

Canonical customer record: what to store and who owns it

Minimum canonical schema: Keep this small and explicit so every integration can implement it fast. At minimum you need external_id(CRM contact id), primary_phone, primary_email, membership_status, last_activity_date, consentsms, and consent_email. Add lifetime_value, preferred_channel, and last_ticket_id only if you will use them to change routing or escalation logic.

Ownership model: Declare the system-of-record per field in the schema as fieldsource. Store a last_synced_at_timestamp and a source_origin tag with every profile. That makes it trivial to debug which system overwrote a value and prevents the automation layer from accidentally becoming the canonical source for membership_status or billing flags.

Identity stitching strategies and trade-offs

Deterministic first, probabilistic second: Use exact matches on external_id, phone, or email to link records. Only fall back to probabilistic joins (name + address + recent booking) for enrichment, and never use those matches to authorize irreversible actions like refunds or cancellations. Probabilistic matches reduce manual merge work but carry false-merge risk—treat low-confidence matches as suggestions for manual review.

Merge governance: Never auto-merge on a single changing field such as phone number. Implement a merge queue with confidence scores, an audit trail, and a rollback path. For B2C membership businesses, incorrect merges are more damaging than duplicate profiles because they misattribute payments and loyalty.

Event taxonomy and canonical fields mapping

Standardize events: Define a small event vocabulary your automation expects: message_received, ticket_created, payment_failed, appointment_booked, check_in, no_show, refund_initiated. Each event must carry event_id, external_id (customer), source_system, and time_stamp so retries do not create duplicate tickets or messages.

Mapping rule: For each event map exactly which canonical fields the automation will read and which it may write back to the CRM. For example, a payment_failed_event should read membership_status, last_payment_date, and consent_sms and write a last_ticket_id and escalation flag only after human review for high-value accounts.

Operational limitation: Real-time bi-directional syncs are ideal but introduce complexity: race conditions, out-of-order events, and schema drift. Avoid trying to sync every CRM field; instead publish a stable contract of 8–12 fields and version it. Versioning prevents surprise failures when a CRM admin renames a custom field.

Example in practice: A regional retail chain used a hashed externalidtied to POS receipts and the booking system. When a customer submitted a return via chat, the automation layer used the hashed id to attach the correct purchase history and check membership_status before approving an instant refund. Cases that failed the deterministic check were routed to a fraud specialist with the candidate matches and confidence scores.

Quick implementation checklist:

– Define the canonical fields and assign field_source for each.

– Implement deterministic matching first (external_id, phone, email).

– Add probabilistic joins with confidence scores and manual merge flow.

– Require eventid + idempotencykey on all events to avoid duplicates.

– Version your schema and expose lastsyncedat for troubleshooting.

Judgment: Conservative identity rules win in B2C. Prioritize correct routing for high-risk actions over broad automated coverage. It is better to escalate a case to a human than to automate an irreversible action on a low-confidence match.

Next consideration: after you lock the canonical schema and matching rules, instrument merge failures and low-confidence matches as KPIs so the team can measure whether your stitching is improving or creating new manual work.

Automation recipes and sample workflows for B2C verticals

Practical premise: Deliver automations as tiny, testable transactions that read CRM state, decide, act, and write a minimal result back. Large, all-in-one flows fail more often than they succeed because of race conditions, edge cases, and data mismatches.

Fitness clubs — membership-driven class and billing workflows

Workflow sample: Automate membership renewal nudges and class rescheduling using a three-step orchestration: (1) event membershipexpires30d triggers a targeted offer, (2) automation reads membership_tier, last_attended, and consent_sms from the CRM, (3) if member engages, create a task follow_up_sales or complete renewal via human-approved link. Keep the automation read-heavy; require human approval for discounts or refunds.

Wellness studios — appointment confirmations and no-show containment

Workflow sample: Send an initial confirmation, a prep reminder 48 hours before, and a two-way check-in 1 hour before class. On a negative reply (reschedule or cancel) the automation checks cancellation_policy, opens a ticket, and offers rebooking. Trade-off: richer conversational flows increase engineering and QA effort — build the two-way state machine only for high-value appointment types first.

Healthcare clinics — intake, consent, and urgent escalation

Workflow sample: Patient completes a pre-visit intake form; the automation validates consent flags before writing the record to the CRM and creating an appointment note. If the intake contains urgent keywords, promote the ticket to an escalation queue and attach an audit trail. Limitation: for regulated data never persist free-text clinical answers in ephemeral logs — route them through a secure EHR integration or hashed references only.

Retail and family entertainment — order flows and incident reports

Workflow sample: After a purchase or visit, trigger an order-status sequence that syncs POS sales with CRM external_id, sends delivery/update messages, and auto-creates return tickets when the customer replies with return intents. For in-venue incidents, staff scan a QR to open a prefilled form; automation assigns severity, notifies the manager channel, and schedules a follow-up survey.

  • Idempotency and state: Use an idempotency_key for every inbound event so retries do not create duplicate tickets or messages.
  • Human-in-loop thresholds: Define clear signal thresholds (value, ambiguity, regulatory risk) that force manual review before irreversible actions.
  • Channel cost vs. value: Reserve SMS for time-sensitive or revenue-impacting messages; use email or app push for low-urgency communications to control costs.
  • Testing edge cases: Simulate merged profiles, delayed webhooks, and partial consent to discover brittle branches before production.

Pilot recipe: Choose one high-frequency, low-risk flow (appointment reminders or order status). 1) Map the minimal CRM fields required. 2) Implement deterministic matching only. 3) Add idempotencykeyand eventid. 4) Release to 10% of users, instrument failures and false positives, then expand. For orchestration tooling see Gleantap Features and check delivery behavior with Twilio messaging docs.

Judgment: The best early wins are automations that prevent obvious manual steps and expose a clear rollback path. Do not attempt full conversational automation across every product line at once — validate with a narrow flow, bake observability into the code path, and harden the small number of automations that move the needle.

Implementation roadmap and pilot plan

Start small and treat the integration like a release pipeline. Build a minimal, testable automation that reads a handful of canonical CRM fields, performs one safe action, and writes back a single result. Rapid feedback beats grand designs that fail under real traffic and mixed data quality.

  1. Phase 0 — Discovery (1 week): Inventory systems, message volumes, top customer journeys, and the owner for each field in the canonical record. Produce a heatmap of high-frequency, low-risk flows to prioritize — pick the one that reduces agent touchpoints without requiring irreversible actions.
  2. Phase 1 — Contract and build (2 weeks): Declare a stable contract: 8–12 fields, external_id, and consent_flags for events. Implement deterministic matching only, add webhook retries and a dead-letter queue, and create smoke tests that simulate merged profiles and delayed events.
  3. Phase 2 — Canary pilot (2–4 weeks): Release to a small slice of customers (5–15%) or a couple of locations. Run live monitoring for delivery failures, match confidence, unintended escalations, and customer replies. Use canary metrics to decide whether to rollback, iterate, or expand.
  4. Phase 3 — Harden and automate observability (ongoing): Add replayable queues, alerting on webhook error rates and false-match incidents, and SLA dashboards for containment, escalation, and CSAT. Create runbooks for pause, rollback, and manual takeover.
  5. Phase 4 — Scale (variable): Migrate the highest-value flows to durable API-driven syncs, version the field contract, and schedule monthly reviews to retire flaky automations or add new deterministic joins.

Pilot timeline and governance checkpoints

Week 0–1: finalize contract, map RACI, and prepare test data. Week 2–3: deploy canary to 5–15% and run daily triage for false positives. Week 4+: expand only after meeting acceptance criteria and stabilizing webhook/retry errors. Stop criteria must be explicit — e.g., a spike in misrouted tickets, consent violations, or webhook failure rate above your error budget.

Practical trade-off: Speed of deployment is tempting, but expanding before fixing identity and DLQ behavior creates operational debt. Opt for slower, validated rollouts over broad botched launches that increase manual work and customer complaints.

Concrete example: A fitness chain piloted a membership renewal automation for two branches. They targeted expiring members with confirmed consent_sms and deterministic matches only, routed ambiguous matches to a manual queue, and limited the offer to a standard renewal (no discounts). The pilot ran as a 6-week canary: engineers tracked webhook retries and match confidence; CSAT and manual touch volume were the go/no-go signals for expansion.

Key judgment: Do not automate irreversible actions in the pilot. Prove read-heavy automations first, then add write capabilities behind approvals and human-in-loop gates.

Next consideration: after a successful pilot, schedule a technical debt sprint to convert brittle connectors to durable APIs, lock the schema version, and add governance so each new automation is treated as a monitored product with clear rollback and escalation paths.

Instrumentation, KPIs, and measurement templates

Start by instrumenting decisions, not only outcomes. When automation reads CRM fields to decide routing or to suppress outreach, you must log the decision inputs, the rule evaluated, and the action taken. Without that telemetry you will never know whether failures come from bad data, brittle rules, or delivery failures.

What to capture for every automated interaction

Minimum event payload: record event_id, external_id, rule_id, decision_outcome, timestamp, channel, delivery_status, and match_confidence. Match confidence is the single field that separates safe automation from risky automation—treat anything below your threshold as a human handoff.

KPIDefinitionPrimary data sourceQuick calculationOperational target (example)
First response time (FRT)Time from customer message to first automated or human response[CRM] message events + automation logsmedian(response_time) grouped by channelUnder 15 minutes for digital channels
Automation containmentShare of inbound conversations resolved without human agentAutomation outcomes + ticketing systemresolved_by_automation / total_inbound20–40% for mature knowledge-backed bots
False-positive escalation rateAutomations that created a ticket unnecessarilyAutomation logs + ticket dispositionsunnecessary_tickets / automation_runsUnder 3% for high-volume flows
Incremental renewal liftRevenue or renewals attributable to automated outreach vs controlA/B experiment cohorts in CRM + billing(renewal_rate_treatment – renewal_rate_control) * avg_revenue_per_memberDepends on cohort; show as absolute $ and %
Match-confidence failure rateEvents routed to manual review due to low identity confidenceMatching service + automation logslow_confidence_count / total_matchesTrack trend toward 0; accept short-term higher during migration

Practical trade-off: heavy instrumentation increases storage and analyst work. Capture raw payloads for 7–14 days, then persist only hashed identifiers and aggregated metrics for long term. This keeps audits reproducible while limiting PII proliferation.

Measuring impact: experiment design and attribution

Design experiments at the customer level, not the message level. Randomize cohorts in the CRM by external_id and hold routing, timing, and offer constant between variants. Measure both short-term support load (tickets avoided, handle time saved) and downstream revenue signals (renewals, upgrades) with at least one billing cycle of lag.

Concrete Example: A fitness chain A/B tests an automated renewal sequence. Group A receives the sequence, Group B receives a manual email. After one billing cycle calculate incremental renewal lift with renewal_rate_treatment – renewal_rate_control and multiply by avg_lifetime_value to get incremental revenue. Track also ticket volume and CSAT for the same cohorts to avoid revenue gains that degrade experience.

  • Alert rules to add immediately: high webhook failure rate, automation containment below expected floor, sudden spike in false-positive escalations.
  • Sampling and logging policy: full logs for canary cohorts, aggregated metrics for production; purge raw text that contains PII after the retention window.
  • Attribution caution: do not claim revenue uplift from outreach unless cohorts are randomized and you control for seasonality and channel overlap.

Key recommendation: instrument decisions-first (inputs + rule + outcome) and run controlled experiments before expanding write-capable automations.

Measurement template starter: store an events table with columns event_id, external_id_hash, rule_id, decision, confidence_score, action_sent, delivery_status, ticket_id, created_at. Use this table to compute containment, false-positive escalations, and match-confidence trends. For delivery testing, compare against provider docs like Twilio messaging docs. For orchestration capabilities see Gleantap Features.

Next step: pick three indicators to watch during your canary—match-confidence failure rate, automation containment, and false-positive escalations—and make them gating metrics. If any one of them breaks your stop criteria, pause the automation, review decision logs, and roll back the single rule rather than the whole system.

Security, consent, and compliance controls

Immediate reality: failed consent and sloppy logging are the single biggest operational risk when you put CRM customer service automation into production. Automations that send the wrong channel, to an opted-out contact, or that retain regulated free-text can trigger complaints, fines, and lost trust far faster than any uptime incident.

Controls that stop incidents before they start

  • Consent registry: persist per-channel consent with consent_source, consent_timestamp, and consent_version in the CRM so every automation can check the exact legal basis before sending.
  • Channel suppression sync: maintain live suppression lists (SMS, WhatsApp, email) and push them to the messaging provider via API; never rely on local caches longer than your retry window.
  • Signed webhooks and mutual TLS: authenticate inbound events to prevent spoofed triggers and ensure idempotency keys are validated before any write-back to the CRM.
  • Role-based write gates: require elevated approvals for automations that perform irreversible actions (refund, cancel_membership) and log the approver id with the action.
  • PII minimization and hashing: store only the fields needed for routing; use hashed external_id in operational logs and redact free-text that contains health or payment details.
  • Immutable audit trail: stream decisions (inputs, rule_id, outcome) to a tamper-evident log for audits and fast forensics; keep raw payloads short-term only.

Trade-off to accept: keeping detailed consent receipts and raw payloads makes audits straightforward but increases PII surface and storage costs. The pragmatic approach is layered: keep full payloads for 7–14 days for debugging, then persist a hashed event summary and the consent proof indefinitely.

Practical limitation: many connectors and middleware do not propagate opt-outs reliably under error conditions. If your integration layer can lose a suppression update, assume the worst: design automations to check live consent from the CRM for any outbound campaign rather than relying on cached provider lists.

Concrete example: A family entertainment center sells tickets online and uses WhatsApp for delivery messages and promos. At checkout the system records explicit WhatsApp opt-in with a consent_version and legal text. The automation reads that field before sending a promotional sequence; if the message contains a safety incident (staff report of injury), the flow writes a secure case to the CRM, redacts the incident text in ephemeral logs, and elevates the ticket to a human with the unredacted record only accessible to clinicians and compliance via RBAC.

Judgment: prioritize detection and safe-fail behavior over automation reach. It is better to pause a campaign when consent checks fail or a webhook behaves oddly than to attempt complex recovery later. Teams routinely underestimate the operational burden of post-hoc consent reconciliation.

When you implement this: store consent as canonical fields in the CRM and propagate them via bi-directional API to your messaging provider, authenticate webhooks per Twilio messaging docs, and keep a visible consent history in the agent UI so human reviewers can validate decisions quickly. For orchestration and consent propagation tools see Gleantap Features.

Key control bundle: live consent checks + per-channel suppression sync + signed webhooks + RBAC for irreversible actions. Log decisions with hashed ids for audits and retain raw payloads only short-term.

Next consideration: wire legal and ops into change control so every automation that touches personal data has an approved consent policy, a test that simulates opt-out scenarios, and a rollback plan that can be executed in minutes.

Common pitfalls, troubleshooting checklist, and operational playbooks

Immediate reality: Automation behaves perfectly in a sandbox and imperfectly in production. The failure modes are operational — not theoretical — and you need reproducible playbooks before the first canary blows up.

Top failure patterns I’ve seen

Failure pattern – identity drift: When the automation and CRM disagree about who the customer is, messages go to the wrong person or automations apply incorrect business rules. Consequence: misrouted tickets, inappropriate refunds, and damaged trust. Fixing this later costs more than building conservative matching rules up front.

Failure pattern – consent mismatch: Opt-out changes in one system that never propagate to the other. Consequence: regulatory exposure and unhappy customers. Treat the CRM consent flag as canonical and make live checks mandatory for outbound sequences.

Practical troubleshooting checklist (ordered)

  1. Verify identity confidence: Query recent match scores for affected external_id and confirm deterministic joins; if scores are low, mark events for manual review.
  2. Check the DLQ and replay queue: Inspect dead-letter items, note failure reasons, and attempt controlled replays to a staging path before replaying to production.
  3. Inspect decision logs: Pull the rule evaluation trace (inputs, rule_id, outcome) for the failing interaction to see whether bad data or a logic change caused the action.
  4. Validate consent at send time: Cross-check per-channel consent fields in the CRM; if a mismatch exists, pause the campaign and run remediation.
  5. Provider health check: Correlate delivery failures with provider status pages and rate-limit errors; if provider throttling is the issue, throttle the automation or switch channels.
  6. Roll-forward mitigation: If the flow is harmful, toggle the automation to read-only or route to a manual queue; document the exact change and the person who made it.

Trade-off to accept: Pausing an automation reduces short-term throughput and may push volume to agents, but continuing a broken automation amplifies errors and customer harm. Err on the side of containment over coverage.

Operational playbooks you can adopt today

Playbook – incident triage (5 steps): 1) Scope the blast radius (affected customers, flows, channels). 2) Freeze the offending rule or move it to a manual queue. 3) Create a dedicated incident thread with RACI (ops, eng, product, legal). 4) Prioritize remediation (data fix, replay, schema rollback). 5) Communicate to stakeholders and affected customers with a precise, traceable message.

Playbook – backfill and customer remediation: When messages were missed or incorrect, do not bulk resend without human review. Instead: identify impacted external_id hashes, create templated personal outreach (with apology and corrective action), and log the remediation in the CRM with a public audit note.

Playbook – manual takeover: Equip agents with a single-click takeover button that pauses automation for the customer, attaches the decision trace to the ticket, and records the agent id and reason. This reduces toggling and supports quick recovery.

Concrete example: A mid-sized fitness operator experienced duplicate class invites after a webhook broker started re-delivering events. They paused the invite rule, inspected the DLQ, and replayed deduplicated events to a staging path. They then sent a targeted apology and a single free class credit to affected members; ticket volume dropped and CSAT recovered in two days.

Key judgment: Build cheap, executable playbooks before you scale automations. Real-world resilience comes from quick containment, clear ownership, and decision-level logs — not from hoping your connector never fails.

Real-world integrations and examples

Direct observation: In production the integration that survives is the one built around operational realities — who owns fixes at 2am, how failures are surfaced, and which system is allowed to make irreversible changes.

How teams actually wire automation to CRMs

Common architecture in practice: Teams combine a lightweight event bus, a short-term enrichment lookup to the CRM, and a small set of write-back actions gated by human approval. That keeps the automated decision path short and observable while preventing accidental writes to billing or membership state.

Practical trade-off: Using a middleware or native connector accelerates pilots but creates blind spots for observability and replay. In other words, you can get to market fast, but you will pay later in longer incident triage and more manual remediation unless you add explicit event logging and a dead-letter process.

  • When low friction matters: Use native connectors for simple notification flows (confirmations, reminders) so ops can own changes without engineering involvement.
  • When auditability matters: Use API-driven, event-first architectures that persist event_id and decision_trace for each automated action.
  • When scale or custom objects matter: Build durable syncs and idempotent write endpoints; connectors will mis-handle bespoke membership logic and loyalty tiers.

Concrete Example: A regional fitness club implemented Gleantap to orchestrate SMS reminders and track failed payments. The automation listens for a payment_failed event, queries the CRM for membership status and recent payments, and only creates a ticket if the deterministic match is strong; ambiguous cases are queued for agent review. This reduced noisy agent work and avoided false refund approvals.

Another real use case: A multi-location clinic uses Twilio conversational flows linked to Salesforce so appointment reminders are two-way. When a patient replies reschedule, the bot checks availability via a lightweight API call, tentatively holds the slot, and writes a pending change to the CRM while flagging the case for human confirmation if conflicts appear. The key is short-lived holds and explicit human gating for final writes to the calendar.

Judgment you should apply: If your business tolerates occasional manual fixes better than customer-facing errors, prioritize fast pilots with connectors but plan to harden the top 2–3 flows to API-driven integrations within the first two quarters. Do not treat a connector proof as production architecture without adding decision logs, DLQs, and role-based write gates.

Key takeaway: Design for failure and for human takeover. Ship fast with connectors or middleware, but instrument every decision, dead-letter every ambiguous event, and convert high-impact flows to API-first integrations. For orchestration that understands membership logic see Gleantap Features and validate delivery/webhook behavior against Twilio messaging docs.

Frequently Asked Questions

Direct point: This FAQ focuses on operational tradeoffs and decision criteria you will actually need when wiring CRM customer service automation into production, not marketing talk.

Q: How does CRM customer service automation move the needle on membership retention? A: Automations that use CRM context to target at risk members and trigger timely touchpoints reduce friction in the renewal path. Practical caveat: the lift comes from correct targeting and sequencing, not message volume. If identity or consent is wrong, you amplify churn instead of preventing it.

Q: Which integration approach should a small chain choose first? A: Start with built in connectors or an integration platform to prove value quickly. Reserve engineering time to harden only the highest impact flows into API driven syncs. The tradeoff is speed now versus operational debt later; plan for a staged migration so pilots do not become fragile long term.

Q: What minimal fields must be synchronized between CRM and automation? A: At minimum sync a canonical id, primary phone, primary email, membership status, last activity date, and per channel consent flags. Treat additional enrichment fields as optional until you have stable matching and clear use cases that justify the added mapping work.

Q: Can automation handle two way conversations and bookings reliably? A: Yes, but only with explicit conversational state, conflict detection, and human handoff gates. Implement short lived holds for tentative bookings and require manual approval for final writes when match confidence is low.

Concrete Example: A multi location clinic connected Twilio conversational flows to Salesforce so patients can reschedule by message. The bot places a tentative hold via a lightweight availability API and writes a pending change to CRM; conflicts escalate to staff with the decision trace attached. This reduced call volume while keeping staff in the loop for final confirmations.

Q: How do I avoid automation feeling impersonal? A: Use CRM attributes to drive message variants and show the reason for an automated action in the message (for example membership tier or last visit). Always include a clear, low friction path to human help and instrument the handoff so agents see why the automation acted.

Q: What are the most important measurement and safety checks during a pilot? A: Gate on match confidence failures, automation containment, and false positive escalations. Log decision inputs and outcomes so you can diagnose whether failures are caused by data, rule logic, or delivery.

Key judgment: Prioritize conservative, observable automation that reduces agent work without increasing risk. Automate confirmations and read only flows first, then add writes behind approvals and clear telemetry.

Actionable next steps: 1) Pick one low risk, high frequency flow to pilot; 2) Define the 8 canonical fields and set field ownership in the CRM; 3) Run a 6 week canary with decision logging, DLQ, and explicit stop criteria.

Next concrete actions you can implement now: 1) Add a match confidence score to your events and block automated final writes below your threshold. 2) Expose the decision trace to agents in the ticket UI. 3) Create a one click pause for any automation per customer so agents can take over immediately.

Customer Attrition in SaaS: Causes, Metrics & Prevention

SaaS customer attrition quietly eats revenue and inflates acquisition costs; a few percentage points of churn change the math for every growth plan. Customer attrition starts earlier than you think—here’s how to spot it before it impacts your numbers. This guide delivers a practical, data driven playbook to measure root causes, build predictive signals, and run targeted prevention campaigns you can operationalize with Gleantap and common data tooling like Stripe, Segment and Mixpanel. You will get exact formulas, SQL snippets, campaign templates and a 30 to 90 day roadmap to prioritize actions that move retention and deliver measurable ROI.

1. Why customer attrition matters for B2C SaaS and how to quantify its financial impact

Concrete point: A few percentage points of monthly churn change unit economics more than equivalent increases in acquisition. Use simple math now so decisions about pricing, onboarding, and billing are grounded in revenue impact, not intuition.

Key formulas to quantify impact

Formulas: Monthly Churn Rate = (Customers lost in month) / (Customers at start of month). Annual Churn ≈ 1 – (1 – Monthly Churn)^12. Logo Churn = count of customers lost over period. MRR Churn = (MRR lost from cancellations + downgrades) / MRR at period start. Net Revenue Retention = (MRR end of period from existing cohort) / (MRR start of period from same cohort). Customer Lifetime Value (simplified) = ARPA / Monthly Churn Rate.

InputValueNotes
ARPA$20Average revenue per account per month
Monthly churn (baseline)6%Observed for cohort
Customer lifetime (months)1 / 0.06 = 16.67Simplified inverse of churn
LTV (baseline)$20 * 16.67 = $333Simplified LTV without margin or discounting
Monthly churn (improved)4%Reasonable target after fixes
LTV (improved)$20 * 25 = $500LTV increases 50 percent when churn drops 6% to 4%
CAC$80Acquisition cost per customer
Payback and marginBaseline payback ~0.24 months of LTV after CACShows how sensitive payback and ROI are to churn

Practical insight and tradeoff: The simplified LTV = ARPA / churn formula is useful for scenario planning but overstates value when you ignore gross margin, discounting, and cohort effects. Use it for quick prioritization, then replace with a discounted cash flow LTV when you present estimates to finance.

Voluntary versus involuntary churn: Voluntary churn is behavioral or value driven – poor onboarding, product mismatch, price sensitivity. Involuntary churn is payment related – card declines, expired cards, failed webhook handling. They require different fixes: product and messaging for voluntary, billing infrastructure and retry logic for involuntary.

  • Why this distinction matters: Involuntary churn can often be reduced quickly with engineering and communications work, delivering high ROI within 30 days.
  • Tradeoff to accept: Focus first on involuntary fixes and 7 day onboarding rescue flows – they are low friction and high return. Larger product changes reduce long term voluntary churn but take longer and cost more.

Concrete example: A mid sized fitness studio with ARPA = $20 and CAC = $80 measured monthly churn at 6 percent. After fixing failed payment retries and adding a 7 day activation SMS flow, monthly churn fell to 4 percent. That single change increased simplified LTV from roughly $333 to $500, shifting the CAC to LTV ratio from marginal to profitable and freeing budget to scale acquisition.

Actionable next step: Compute current ARPA, CAC, Monthly Churn, and LTV in a simple spreadsheet. Use the numbers to model 1 and 2 percentage point churn improvements and show revenue lift for the next 12 months. If you want a template, connect billing to Gleantap and export a basic cohort table to start.

Final takeaway: Treat churn percentages as levered controls. Fixing low hanging billing and onboarding issues yields quick, measurable LTV gains; reserve larger product investments for problems that persist after these tactical wins.

2. Root cause taxonomy: common drivers of churn in B2C SaaS and how to detect them

Concrete point: Most churn falls into a short list of failure modes you can detect with a handful of events — onboarding gaps, declining use, billing problems, price or packaging friction, support breakdowns, and competitive defections. Instrument those signals first; everything else is a refinement.

Why this matters in practice: Detecting the right driver lets you choose an automated prevention play (billing retry, onboarding nudge, targeted discount, or CS escalation) instead of guessing. False positives are the real cost here — too many alerts and you waste channels and goodwill.

DriverHigh-signal events or attributesQuick detection / sample query
Onboarding failureNo key activation events in first 7 days (no session.started, profile.completed, or first_booking)SELECT user_id FROM events WHERE event_date BETWEEN sign_up_date AND DATEADD(sign_up_date, INTERVAL 7 DAY) GROUP BY user_id HAVING COUNT(CASE WHEN event_name IN (session.started,profile.completed,first_booking) THEN 1 END)=0;
Product disengagementDecline in weekly active sessions, falling DAU/MAU ratio, long gap since last sessionSELECT user_id FROM activity WHERE last_session_date < DATESUB(CURRENT_DATE, INTERVAL 30 DAY);
Price sensitivity / downgrade activityRecent plan downgrade, coupon usage, or abandoned upgrade checkoutSELECT user_id FROM subscriptions WHERE change_type=downgrade AND change_date > DATESUB(CURRENT_DATE, INTERVAL 60 DAY);
Billing / payment issuesCard declines, multiple failed charges, or unresolved invoice.status != paidSELECT customer_id FROM invoices WHERE status=failed AND failed_attempts>=2 AND invoice_date > DATESUB(CURRENT_DATE, INTERVAL 14 DAY);
Support frictionHigh SLA response time, repeated reopenings of tickets, NPS <=6SELECT customer_id FROM tickets WHERE reopened_count>1 OR avg_resolution_hours>72;
Competition / feature gapSpike in cancellations following competitor campaigns, or feature usage below cohort peersCompare cancellation_delta by acquisition_source and correlate with external campaign dates (requires mapping source and campaign windows).

Practical tradeoff: Be explicit about detection sensitivity. A conservative rule set minimizes false outreach but misses early risk; an aggressive set finds more at-risk users but increases campaign volume and costs. Start conservative for paid channels like SMS, then widen once you validate uplift with A B tests.

  • Detection latency: Billing signals can appear immediately; behavioral signals often require a 7–30 day lookback. Don’t treat both the same for trigger cadence.
  • Signal hygiene: Reconcile user IDs across billing and product data first. Mismatches create either invisible churn or phantom risk flags.
  • Channel cost consideration: Triggered SMS and calls are expensive — reserve them for high-probability scores or high ARPA customers.

Concrete example: A regional fitness studio instrumented class.booked and visit.logged. They flagged members with no visits and no bookings for 30 days, then ran a two-step campaign: a behavioral email with a personalized class suggestion, followed by an SMS with an easy rebook link for those who didn’t open. Within six weeks they recovered a measurable share of at-risk members and identified coaches whose classes drove reactivation.

Priority next step: Implement the three simplest detectors now: 7-day activation = 0, any invoice.failed in last 14 days, and lastsessiondate > 30 days. Pipe those attributes into profiles in Gleantap and measure false positive rate over two weeks before expanding triggers.

Judgment to apply: Don’t chase exotic signals before your basics are solid. Most meaningful churn reduction comes from fixing payment flows and rescuing poor first-week experiences. Once those stop being the largest contributors, invest in richer cohort or attribution signals to address more subtle product-market fit issues. For a compact read on the upside of retention, see the HBR stat on retention value: The Value of Keeping the Right Customers.

3. Metrics, dashboards and reproducible queries to measure churn and retention

Direct point: A reliable retention program starts with a small, versioned set of queries that everyone trusts. If dashboards are hand edited, thresholds drift, or queries are unreproducible, your retention team will argue about the numbers instead of acting on them.

Minimum schema to make metrics reproducible

Required fields: Store these core columns in a canonical table or materialized view: customer_id, signup_date, subscription_id, plan_price, invoice_id, invoice_status, invoice_amount, charge_attempts, event_date, event_name, channel_optin_flags. Keep billing and behavioral events in the same warehouse schema or a joined view to avoid ID mismatch. Use Gleantap profiles as the downstream target for scores and flags.

PurposeBigQuery snippet (condensed)
Monthly cohort retention (users active each month since signup)WITH cohorts AS ( SELECT customer_id, DATETRUNC(signup_date, MONTH) AS cohort_month FROM project.dataset.customers ), activity AS ( SELECT customer_id, DATETRUNC(event_date, MONTH) AS active_month FROM project.dataset.events WHERE event_name IN (session.started,class.booked) ) SELECT c.cohort_month, a.active_month, COUNT(DISTINCT a.customer_id) AS active_users FROM cohorts LEFT JOIN activity a USING (customer_id) GROUP BY cohort_month, active_month ORDER BY cohort_month, active_month;
Gross and net MRR churn for periodSELECT period, SUM(CASE WHEN change_type=cancellation OR change_type=downgrade THEN deltamrr ELSE 0 END) / start_mrr AS gross_mrr_churn, (SUM(delta_mrr * -1) + SUM(expansion_mrr)) / start_mrr AS net_mrr_churn FROM project.dataset.mrr_movements WHERE period BETWEEN DATESUB(CURRENTDATE(), INTERVAL 12 MONTH) AND CURRENT_DATE() GROUP BY period, start_mrr;
Rolling 12-month logo churn tableSELECT month, COUNT(DISTINCT CASE WHEN cancelled_between(month, DATEADD(month, INTERVAL 12 MONTH)) THEN customer_id END) / active_start AS rolling_logo_churn FROM UNNEST(GENERATEDATEARRAY(DATETRUNC(DATESUB(CURRENTDATE(), INTERVAL 11 MONTH), MONTH), DATETRUNC(CURRENT_DATE(), MONTH), INTERVAL 1 MONTH)) AS month JOIN project.dataset.subscriptions USING (customer_id) GROUP BY month, active_start;

Practical tradeoff: Short lookbacks (7–30 days) surface early behavioral risks but increase noise; longer windows (90–365 days) give stability but delay detection. Use short windows for triggers and longer windows for executive reporting—both must come from the same, versioned SQL so numbers reconcile.

  • Dashboard minimum (6 KPIs): Monthly churn rate, Net revenue retention (cohort), 30-day activation rate, 90-day cohort survival, share of involuntary churn, distribution of customer health score.
  • Operational rule: Back every KPI with a single source-of-truth query stored in Git and scheduled (dbt, Airflow, or your warehouse scheduler).
  • Alerting cadence: Weekly thresholds for product and billing teams; daily for payment failure spikes.

Concrete example: A multi-location fitness operator implemented the cohort retention query above, scheduled it to run every Monday, and exported the flagged cohort (30-day no-activity + invoice.failed) into Gleantap. That weekly handoff fed an automated billing-retry plus a personalized 3-step SMS reengagement flow; within eight weeks the ops team reduced recoverable involuntary churn and stopped manual triage.

Actionable next step: Put three queries into version control this week: cohort retention, gross/net MRR churn, and an involuntary churn detector (invoice.failed > 0 in last 14 days). Schedule them and wire outputs to profile attributes in Gleantap so campaigns trigger from the same, auditable source of truth.

Judgment: Teams waste time debating metric definitions more than they fix root causes. Invest a day to lock definitions, automate the SQL, and enforce simple tests (row counts, null checks). That discipline produces the consistent signals necessary to run reliable experiments and scale prevention plays.

4. Building predictive signals and lightweight churn models without hiring a data science team

Direct assertion: You can produce reliable, actionable churn signals with a few SQL queries and a transparent model; you do not need a full data science org to start preventing churn. The goal is a repeatable score that surfaces the right customers for automated prevention, not a perfect model that explains every edge case.

Feature recipe and labeling

Core features to build first: recency (days since last session), short term frequency (visits in 7 and 30 days), trend slope (change in visits week over week), tenure (days since signup), payment friction count (invoice.failed count), support contacts (tickets in last 30 days), NPS or survey score, and plan ARPA. Keep features interpretable and fast to compute so product owners can validate them.

Label choice and lookback: Define churn as cancelled or not renewed within a defined horizon – common choices are 30, 60 or 90 days depending on cadence. Short horizons surface immediate risk but create class imbalance. Pick one, document it, and stick with it for evaluation.

Model approaches, tradeoffs and evaluation

Start simple: a rule based score or a logistic regression gives transparency and is easy to operationalize. If you need better accuracy later, move to a tree based model. Tradeoff to accept – simple models are easier to explain and debug; complex models usually improve lift but require monitoring and retraining.

  • Rule based baseline: weighted sum of 3 signals, easy to tune and low risk for false outreach
  • Logistic regression or decision tree: use BigQuery ML or scikit-learn for a first production model, export coefficients or simple decision rules for product teams
  • What to measure: precision at top 10 percent, recall for flagged segment, ROC AUC, and calibration across score buckets

Operational cadence: run scoring daily for payment related signals and weekly for behavioral risk. Persist scores to customer profiles and create attributes like churn score and churn bucket so campaign tools can consume them. For bi directional sync use your warehouse to update profiles in Gleantap product or push via webhooks.

Practical limitation: labeled training data often contains survivorship bias. If you only train on customers who reached cancellation, the model learns the end state rather than early signs. Mitigate by including negative examples from the same cohort windows and by holding out a time based validation set.

Concrete use case: A regional fitness operator computed visits in the prior 7 and 30 days, invoice.failed count, and tenure. They trained a logistic model in BigQuery ML, scored weekly, and pushed top 8 percent into Gleantap. Automatic SMS sequences to that bucket produced measurable rebookings and reduced avoidable cancellations for mid tier plans within 60 days.

Starter build checklist: 1) Define churn label and horizon, 2) Create feature SQLs for recency, frequency, billing fails, support counts, 3) Train a logistic model (BigQuery ML or sklearn), 4) Evaluate precision@10%, 5) Export scores to profiles and wire a top-decile campaign in Gleantap product. Aim to complete steps 1-4 in two weeks.

Judgment: Most teams spend too long chasing marginal accuracy gains. Focus first on operational reliability – reproducible feature queries, transparent models, and a small A B test that measures incremental retention. If a simple model finds high value customers consistently, scale the workflow before investing in more complex modeling.

Next consideration: pick a single threshold and run a small holdout experiment for 30 to 60 days to validate precision and uplift before widening outreach.

5. Prevention playbook: automated campaigns and interventions mapped to root causes

Direct point: Prevention is tactical — map one clear automated sequence to each root cause, then measure lift from that single sequence before adding complexity. Automation without tight mapping wastes channels and masks which fixes actually move retention.

Core play patterns and when to use them

Play patterns: Use short, deterministic flows for billing problems, timed onboarding drips for activation gaps, and personalized reactivation for behavioral decline. Tradeoff: deterministic flows are low risk but hit fewer customers; personalization improves conversion but increases engineering and data cleanup work.

  • Billing recovery (automated, high priority): trigger on invoice.failed or card.expiry, escalate by retry attempts, reserve human outreach for VIPs.
  • Activation rescue (time-based): start within 24 hours, add behavioral checks at day 7 and 14, convert to CS handoff when low engagement persists.
  • Behavioral reactivation (personalized): use last product touch, top recommended item/class, and a small incentive; prefer SMS for immediate CTAs and email for richer context.

Practical consideration: Prioritize flows by expected recoverable revenue, not raw customer count. An automated billing flow that recovers mid-tier subscriptions will usually beat a broad discount blast aimed at low-ARPA users. Reserve paid channels for segments where the expected lift exceeds communication and support cost.

Three copy-and-run campaign templates

  1. Onboarding rescue (fitness clubs): Day 0 SMS: Welcome to [Studio]. Book your first class with one tap: book.link. Day 1 Email: short how-to + 3 recommended classes based on signup. Day 7 SMS if no booking: We miss you — complimentary guest pass for a friend if you book this week. Book: book.link. Escalate to CS on day 14 for persistent non-activation.
  2. Billing recovery (Stripe/Chargebee webhook): Immediately on first fail: Email with one-click update card link + retry schedule. After second fail (48 hours): SMS: Quick — update card to keep access: update.link. After third fail (96 hours): Phone outreach for ARPA above threshold. Use exponential backoff for retries and log every contact attempt into profile.
  3. Behavioral reactivation (high value customers): Segment: last activity 30-60 days, top-class missed. Day 0 Email with personalized suggestion and 48-hour limited discount. Day 3 SMS reminder with direct booking link. Day 10 VIP offer: one free session + CS call for members in top revenue quartile.

Concrete example: A multi-location studio ran the onboarding rescue above. They triggered the Day 1 email and Day 7 SMS only for customers with zero bookings. Within six weeks they reduced 30-day cancellations in the cohort by capturing members who had signed up but never scheduled, and they discovered that one specific class type and instructor had disproportionate reactivation power.

Judgment: Avoid blanket incentives. Heavy discounting erodes LTV and trains customers to wait for offers. Use targeted, time-limited incentives tied to behavioral signals and escalate to human outreach only for high-ARPA or high-likelihood-to-convert segments.

Actionable next step: Implement the billing recovery flow first. Wire invoice.failed into Gleantap via webhook, create the 3-step messaging sequence above, and measure recovered MRR after 30 days. If recovery rate is low, audit retry logic and update-card UX before changing messaging.

Important: test one flow at a time with a holdout. If you start five interventions simultaneously you will not know which one actually reduced churn.

6. Technical checklist to ensure reliable data and integrations

Concrete point: Data plumbing—not model quality or messaging—causes more lost attribution and wasted campaigns than any other technical issue. If your customer profiles drift, your best churn model will surface the wrong people and your retention automations will fire at the wrong time.

Minimum technical steps (prioritized)

  1. Canonical IDs first: Pick one customer identifier (recommended: internal customer_id) and map every external id to it. Persist the mapping in a single canonical table so billing, product events, and CRM always join to the same key.
  2. Event contract and versioning: Define a minimal event schema and a changelog. Enforce required fields and types at the producer level so downstream queries never break when an event changes shape.
  3. Webhook resilience and idempotency: Implement retries, dedupe by event id, and log every webhook delivery. Treat transient 5xx failures as temporary and queue them instead of dropping—billing signals need near-zero loss.
  4. Reconciliation jobs: Run daily batch reconciles between billing and analytics (see SQL example). Reconciles should check counts, sums (MRR), and foreign key presence; surface deltas to a Slack channel for immediate action.
  5. Latency SLOs and tradeoffs: Use real-time webhooks for billing failures and score updates that must trigger immediate outreach; use scheduled batch scoring for heavier features (30 day trends). Real-time is faster but demands stricter error handling.
  6. Schema monitoring and alerting: Track schema drift, NULL spikes, and sudden drops in event volume. Alert on percent changes (not absolute) to avoid noise when traffic is low.
  7. Syncing back to execution tools: Persist final attributes (churn_score, billing_status, last_active_date) into the engagement profile store (for example sync to Gleantap) with clear TTLs and update cadence.

Practical tradeoff: Prioritize billing and identity fixes before optimizing model features. Fast reconciliation and robust webhooks recover involuntary churn quickly; sophisticated behavioral features add value only after identity and event loss are solved.

Weekly SQL audit (single quick check)

Run this each Monday: a simple mismatch query that finds customers in billing with no recent product activity or no mapped analytics id. Use it to catch integration gaps early.

— BigQuery style: find billing customers without a matched analytics user in last 90 days

SELECT b.customerid, b.email, b.latestinvoicedate, COUNT(e.eventname) AS eventslast90d

FROM billing.customers b

LEFT JOIN analytics.events e ON b.customerid = e.customerid AND e.eventdate >= DATESUB(CURRENT_DATE(), INTERVAL 90 DAY)

GROUP BY b.customerid, b.email, b.latestinvoice_date

HAVING eventslast90d = 0;

Limitation to watch: This audit flags false positives when you have deliberate offline customers (seasonal users) or when identifiers differ (email vs phone). Have a short whitelist and a manual review queue to avoid noisy alerts.

Concrete example: A regional fitness operator discovered 9 percent of Stripe cancellations had no matched analytics id because their booking vendor sent phone as the primary key while billing used email. They added a hashed-phone mapping step at ingestion, repaired the backfill, and the next weekly audit fell to under 1 percent—improving attribution for billing-recovery campaigns and reducing wasted SMS sends.

Key takeaway: Lock identity mapping and webhook durability before you invest in more churn features. Reliable data amplifies every other retention effort and shortens the path from signal to saved revenue.

Next step: schedule the weekly reconcile and webhook health checks this week, and push the canonical ID mapping into a shared table so product, billing, and marketing use one source of truth.

7. Experimentation, measurement and scaling the retention program

Start with a single, pre-registered question. Run one clean experiment that ties a precise trigger (for example invoice.failed or churn_score > 0.8) to one intervention and one primary outcome. Everything else in the program should be organized to answer that question reliably.

Designing holdouts and power for retention tests

Sample size reality check: if your baseline 90-day churn is 20 percent and you want to detect a 10 percent relative reduction (20% -> 18%) with alpha=0.05 and power=80%, the per-arm sample is on the order of ~6,000 customers. Use the standard two-proportion sample size formula n = (Zα+Zβ)^2 * (p0(1-p0)+p1(1-p1)) / (p1-p0)^2 to compute for your numbers. Small businesses will be underpowered for modest lifts; plan for larger effect sizes or run longer-duration experiments.

Tradeoff to accept: a test sized to detect small relative improvements takes time and limits how many variants you can try. If you lack volume, optimize for bigger, higher-confidence plays (billing fixes, VIP outreach) and use leading metrics (14-day rebooking) for early signals.

Operational steps to run a retention experiment

  1. Register the experiment: create a single row in an experiments registry with id, hypothesis, primary metric, holdout size, start/end dates, and owners (product, marketing, CS).
  2. Lock the metric and SQL: store the exact SQL that calculates the primary outcome in Git and schedule it. No ad hoc dashboard edits once the test starts.
  3. Segment and randomize deterministically: randomize at the customer_id level and persist assignment so retries and re-enrollments don’t contaminate results.
  4. Define early readouts and stopping rules: pick a 14-day behavioral proxy (rebook rate, payment update clicks) for sanity checks and a 90-day final outcome for primary analysis.
  5. Instrument attribution and cost tracking: capture cost per contact (SMS, call time) and recovered MRR so you can compute net ROI, not just relative lift.
  6. Run a scoped holdout: keep a non-zero holdout (5–15%) to measure natural drift and to ensure results scale when you roll out.

Concrete example: a chain of studios randomized 12,000 at-risk members to control or an SMS-first reengagement sequence. Baseline 90-day churn was 20%. The test produced an absolute 1.5 percentage point lift (20% -> 18.5%) in retention in the treatment arm, saving ~180 customers. With ARPA = $25 that translated to roughly $4,500 monthly in retained MRR — enough to fund the SMS spend and a part-time CS follow-up.

Scaling playbooks and naming conventions: store every successful play in a library with a consistent ID. Use a pattern like retention/{play}/{segment}/{variant}/{YYYYMMDD} and tag profiles with last_experiment_id, variant, and experiment_start. That makes rollbacks and audits straightforward when campaigns multiply.

90-day roadmap (practical checklist):

1) Week 0: register experiment, lock SQL, map owners. 2) Week 1–2: run a small pilot (5–10% of eligible) and verify instrumentation; monitor 14-day proxy metrics. 3) Week 3–8: scale to full sample; maintain daily health checks on assignment and messaging logs. 4) Week 9–12: finalize 90-day outcome, compute incremental MRR and cost-per-retained-customer, decide go/no-go for roll out into retention/library and full automation (e.g., push variant to Gleantap).

Next consideration: pick the single primary metric you will defend to leadership and build the experiment registry before you send the first message. Without that discipline you will scale noise, not repeatable wins.

8. Industry specific examples and mini case templates

Direct point: Industry context changes which churn signals are actionable and which prevention plays are worth the cost. Don’t treat every vertical the same — match detection windows, channel mix, and escalation rules to customer cadence, regulatory constraints, and per-customer value.

Fitness clubs and studios

Nuance: For multi-location fitness brands the real problem is scheduling friction and coach-driven retention. Members who stop booking across any single location are at elevated risk, but the root cause is often availability mis-match rather than product-market fit. Detect by joining class.booked with location.capacity and flagging members who attempted to book but hit full classes three times in 30 days.

Practical tradeoff: Aggressive SMS nudges work fast but burn budget and goodwill if the real friction is supply (no open spots). Prefer a two-step approach: a low-cost email with alternate recommendations, then SMS only if the member previously converted from SMS outreach.

Family entertainment centers and retail subscriptions

Behavioral pattern: These businesses are seasonal and often driven by one-off visits. Use season-aware windows (lookbacks tied to school holidays and local events) and map membership usage to redemptions, not just sessions. A season pass holder who redeems zero vouchers in a season is higher priority than a casual monthly subscriber who missed one month.

Operational consideration: Loyalty and tiers matter. A small, targeted free add-on (companion ticket, free rental) will usually recover a high-value member more effectively than a site-wide discount that trains customers to wait.

Concrete example: A regional family entertainment center correlated pass redemptions with local school calendars. They built a 14-day pre-holiday push that reminded pass holders of unused vouchers and offered a one-time add-on for weekday visits. The campaign revived bookings during slow pockets and revealed that weekday availability was the main limiter to retention, not pricing.

Healthcare memberships and compliance constraints

Regulatory constraint: Healthcare outreach must respect consent and PHI boundaries. Prioritize appointment reminders and administrative nudges over promotional incentives, and keep message content minimal to avoid exposing health information. Use email-first for clinical details, SMS for logistics only, and record consent dates as part of the profile.

Tradeoff: Tighter privacy reduces your channel flexibility. Expect lower immediate reactivation rates compared with consumer verticals but fewer regulatory risks and higher long-term trust.

Mini case templates you can copy

  1. Involuntary churn remediation (payment failure – all verticals): Segment: customers with invoice.failed >= 1 and last_successful_payment within 90 days. Trigger: webhook on invoice.failed -> immediate email with update payment link -> 24 hour email reminder -> 48 hour SMS for high-ARPA tiers -> 96 hour CS phone for VIPs. KPIs: recovered MRR (30 days), recovery rate by channel, cost per recovered customer. Measurement window: 30 days post-failure. Implementation note: prioritize user experience on the update flow (one-click card update) — message volume without a clean UX wastes spend.
  2. Product disengagement reactivation (fitness studios): Segment: members with zero bookings and lastvisit > 28 days AND churnscore in top 15%. Trigger: personalized email recommending 2 nearby classes + coach name -> 48 hour SMS with one-tap booking link and a limited free guest pass -> if no action, CS outreach offering a scheduling consultation. KPIs: rebooking rate within 14 days, incremental lifetime value at 90 days, conversion by coach. Implementation note: reserve human outreach for segments with projected recovered LTV above outreach cost.

What practitioners misunderstand: Teams often assume the same trigger cadence works across locations and products. In practice, a uniform 30-day detector either misses seasonal churn or over-sends during off-peak windows. Tune lookbacks to the actual customer rhythm of each vertical and validate with a holdout before full roll out.

Key takeaway: Build one vertical-specific detector and one prevention play this quarter. Measure recovered revenue, not just click rates, and escalate only when the economics justify higher-cost channels or human time. For execution, sync flags and scores to profiles in Gleantap so campaigns are auditable and repeatable.

Start small: implement the involuntary remediation template first. It is the fastest to operationalize and often has the clearest ROI across verticals.

9. Implementation timeline, KPIs to monitor and expected outcomes

Concrete plan: execute retention work in waves: fix what immediately costs you revenue, instrument what proves causality, then scale the highest ROI plays. You want measurable wins inside 30 days, an operational model and A/B evidence by 60–90 days, and a repeatable library for scale thereafter.

Weeks 0–4: unblock revenue and establish signal hygiene

  • Immediate engineering fixes: repair webhook retries, idempotency, and the card update flow so billing failures can be resolved without manual intervention.
  • Low-friction campaigns: launch a 3-step billing recovery automation and a minimal onboarding SMS drip for users with zero activation within the first week.
  • Measurement foundation: wire three production queries (cohort retention, invoice failures, 7-day activation) into scheduled jobs and sync outputs to profiles in Gleantap.

Days 31–90: build, test, and validate

  1. 30–60 days: train a simple, transparent churn score (rule or logistic), push top-risk buckets into Gleantap, and pilot an automated reengagement sequence against a small holdout.
  2. 60–90 days: run a powered A/B or holdout test for the best performing sequence, collect 14-day proxies and the 90-day retention outcome, then iterate messaging and thresholds.
  3. Operationalize: create a retention playbook entry for any test that exceeds your minimum ROI (see info box) and add it to a campaign library with naming conventions and owners.

KPIs to monitor at each stage

  • Weekly cohort churn: run the same cohort query weekly and track directional change; use short windows for triggers and longer windows for stability.
  • Involuntary churn share: percent of cancellations attributable to payment failures — this is the fastest lever for near-term revenue recovery.
  • Activation conversion (7–14 day): proportion of new signups that complete the key activation event within the window; improvement here is a leading indicator.
  • Precision of top-risk bucket: percent of flagged users who exhibit the negative outcome within the horizon — monitor precision to control outreach cost.
  • Recovered revenue per campaign dollar: incremental retained MRR divided by campaign spend and human outreach time — the primary ROI gauge for rollout decisions.

Practical tradeoff: prioritize fixes that move recovered revenue quickly (billing, activation). Predictive models and heavy personalization drive incremental gains but require clean identity and repeatable labeling; don’t invest in model complexity until your precision and reconciliation are reliable.

Concrete example: a regional studio repaired webhook retries and launched an onboarding SMS in the first month. In month two they trained a transparent churn score and ran a holdout A/B test for a targeted reengagement flow. By month three they had enough lift and ROI data to automate the sequence for specific segments and add a CS escalation for high-value members.

How to present outcomes to leadership: show recovered MRR as a simple scenario: recovered_customers × ARPA = monthly retained revenue, then convert that to LTV uplift using your standard horizon and margin assumptions. Present net benefit after campaign costs and CS time so the decision is about profitable retention, not vanity metrics. If you need a wiring reference for campaign audit trails, use Gleantap integrations to demonstrate the end-to-end flow.

Key judgment: quick operational wins are necessary but not sufficient. Expect diminishing returns from the first 30 days; the real scaling decision should be based on repeatable precision and a defensible cost-per-recovered-customer threshold.

10. How Gleantap fits into this retention architecture

Direct placement: Gleantap is the execution and profile layer in the stack — it takes canonical IDs, billing and event attributes, and turns them into actionable segments, scheduled automations, and audit trails for retention work. Connect your billing system and analytics upstream, and Gleantap becomes the single place you push scores, flags, and messages so campaigns are consistent and traceable. See the product integrations for connection options: Gleantap product and Gleantap integrations.

Integration surface and what to expect

Gleantap covers three practical responsibilities: ingest (webhooks and warehouse syncs from Stripe/Chargebee, Segment, Mixpanel/Amplitude), persistent profiles (store churn_score, billing_status, last_active with TTLs), and orchestration (multi-channel flows across SMS, email, and push with escalation rules). It also provides prebuilt templates so you can audit which trigger and message saved a customer.

Tradeoffs to plan for: Using Gleantap speeds operationalization but it is not a substitute for owning your canonical data or training a bespoke model in the warehouse. Expect small delays when pushing large batch scores, and validate that sync cadence meets your trigger requirements — real-time billing events need webhook paths, not nightly syncs. Keep model training and versioning in your data stack so you can reproduce scores independent of any vendor UI.

Practical operational insight: Treat Gleantap as the enforcement layer for campaign guardrails. Push conservative thresholds for SMS or phone escalation from your model (for example, require both a high churn signal and an invoice.failed flag) and use Gleantap rate limits and opt-out handling to prevent channel fatigue and compliance risk.

Concrete example: A multi-location fitness chain wired Stripe webhooks into Gleantap, synced their event stream via Segment, and exposed a churn_score attribute computed weekly in their warehouse. They built a billing-first automation in Gleantap that attempted card update links via email, followed by an SMS for profiles with high scores and recent invoice.failed events, and routed VIP customers to CS for phone follow-up. The change eliminated much of the manual triage and let the CS team focus on true high-touch rescues.

  • Pilot checklist: Connect billing webhooks and analytics sources, validate canonical ID mapping with a sample of 500 customers, sync initial churnscore and billingstatus attributes, enable three automations (payment recovery, activation rescue, top-risk reengage) with conservative sending caps, and define a 10–15% holdout for measurement.
  • Operational guardrails: Set per-customer daily message caps, require double-confirmed opt-in for SMS, and configure escalation rules so only customers above a set projected-recovery LTV receive phone outreach.
  • Data discipline: Keep a copy of all scoring SQL in your repo and export a nightly snapshot to Gleantap so you can repro the profile state that triggered any automation.

Important: vendor convenience should not replace ownership — maintain an auditable score snapshot in your warehouse even when you operationalize in Gleantap.

Pilot success criteria: 1) Recovered revenue per dollar spent on outreach > 1.0 (net), 2) Precision of targeted bucket sufficient to keep SMS volume within budgeted caps, 3) Reduction in manual triage time for CS teams, 4) No privacy or consent incidents during the pilot. Use these criteria to decide whether to widen segments or tighten thresholds.

Next consideration: before you scale, define the escalation economics — the expected recovered LTV that justifies human outreach — and enforce that rule in Gleantap so automation scales without draining support budgets.

Frequently Asked Questions

Direct answer up front: focus on the metric that changes decision-making for your business this quarter. Don’t chase every churn definition at once — pick the one that ties to budget and ops. For most B2C SaaS with varied plan sizes that means prioritizing revenue churn (MRR churn) for finance conversations and customer churn (logo churn) when you measure product-market stability.

How often should I score customers for churn risk?

Short answer: frequency depends on the trigger. Payment events justify immediate scoring and near-real-time action; behavioral decline is properly evaluated on a daily-to-weekly cadence. Running payment-driven scoring in real time and behavioral scoring weekly is a pragmatic tradeoff between accuracy and operational cost.

Can we reduce churn without a data science team?

Yes. Start with transparent rules or a logistic model built in BigQuery ML or scikit-learn. The practical tradeoff is explainability versus marginal accuracy: simple models let product and CS teams validate why someone is flagged; complex models can add a few percentage points of lift but create operational debt.

What is the quickest win for recoverable revenue?

Fix the payment path. Engineering plus one short campaign usually beats tactical product changes in the short term. Improve retry logic, send a one-click update-card flow, and run a targeted multi-step message sequence for recent invoice.failed events — that combo recovers value fast with predictable ROI.

Concrete example: A single-city yoga studio added an immediate webhook handler for invoice.failed, sent an email with a prefilled update-card link, and followed with a timed SMS for customers who didn’t update. Within 30 days they recovered enough monthly recurring revenue to cover the SMS spend and one part-time CS hour; the key win was reducing manual follow-up.

How should I measure campaign ROI for retention?

Measure incremental retained revenue net of costs. Use a holdout or randomized test to calculate recovered MRR attributable to the campaign, subtract channel and human costs, and present the net as retained MRR per dollar spent. If you lack sample size, use short-term behavioral proxies (update-card clicks, rebooking within 14 days) but treat them as directional, not decisive.

Minimum data I need to start right now?

Minimum viable inputs: canonical customer_id, subscription status and invoice events, last activity timestamp, and at least one contact channel (email or phone). Missing any of these breaks attribution and campaign targeting — fix identity mapping before building models.

Practical tradeoff to accept: invest the first engineering hour in canonical ID mapping and webhook durability rather than in fancy features. Clean input yields better downstream lift than marginal model improvements.

When in doubt: run one small experiment. Pick a single trigger, a simple intervention, and a 10–15% holdout. If your incremental retained revenue per dollar is positive after 30–60 days, scale. If not, iterate on the trigger or the UX.

  • Immediate actions (this week): schedule a weekly reconcile between billing and analytics; wire invoice.failed webhooks to an automated recovery flow in Gleantap.
  • Next 30 days: run a small randomized pilot of the recovery flow, capture recovered MRR and cost, and persist churn scores to profiles for campaign targeting.
  • 30–90 day: lock definitions and SQL in version control, scale the flows that show positive net ROI, and add a conservative SMS cap for outreach to control spend.

Don’t expand channels until you can prove the baseline play returns more retained revenue than it costs. That discipline prevents expensive, noisy programs from eroding LTV.

How Club24 Concept Gyms Reduced Past Due Members by 33% and Drove High-Converting Campaigns with Automation

How Club24 Concept Gyms Reduced Past Due Members by 33% and Drove High-Converting Campaigns with Automation

Club24 Concept Gyms

Club24 Concept Gyms is a growing fitness chain operating 7 locations positioned as a budget-friendly gym ($3–$6/week), their business relies heavily on:

  • High member volume
  • Consistent recurring payments
  • Efficient operations at scale

The Challenge

Club24 was previously using GymSales, which limited their ability to:

  • Build advanced automation workflows
  • Run multi-step collections journeys
  • Trigger campaigns based on real-time behavior
  • Scale personalized engagement across locations

Key Problem: Rising Past Due Members

  • ~180 members consistently falling into collections
  • Manual follow-ups + basic automation = inefficient recovery
  • Revenue leakage directly impacting cash flow and profitability

The Solution: Intelligent Automation with Gleantap

After switching to Gleantap, Club24 implemented data-driven, multi-step journeys – starting with their highest-impact use case:

Past Due Collections Journey

Smart Segmentation

Members were automatically segmented based on how long they were overdue:

  • 0–60 days
  • 61–90 days
  • 90+ days

Multi-Step Automated Flow

  • 9–10 touchpoints per journey
  • Mix of:
    • Email
    • SMS
    • Staff task reminders (calls)

Intelligent Automation Logic

  • Members are auto-enrolled when they become past due
  • Messaging cadence adapts based on time overdue
  • Staff tasks triggered only when needed
  • Auto-unenroll when payment is made

No manual tracking. No missed follow-ups.

The Results

33% Reduction in Past Due Members

  • Before Gleantap: ~180 members in collections
  • After a few months: ~120 members

33% improvement in collections efficiency

Business Impact

  • Increased recovered revenue
  • Improved cash flow predictability
  • Reduced write-offs and churn risk
  • Lower dependency on manual collections effort

Bonus Win: High-Converting Prospect Campaigns

Beyond collections, Club24 also leveraged Gleantap for targeted prospect engagement campaigns, seeing anywhere from 15–24% increase in conversions for prospects to members.

What Drove These Results

  • Precise audience targeting
  • Automated multi-touch follow-ups
  • Personalized messaging
  • Timely engagement across channels

Why It Worked

1. Automation at Scale

Every member and prospect gets the right message at the right time – automatically.

2. Behavioral Intelligence

Journeys are triggered by real-time data, not static lists.

3. Multi-Channel Engagement

Combining SMS + Email + Staff Tasks ensures higher response rates

4. Zero Leakage

Auto-unenrollment ensures:

  • No over-messaging
  • Clean workflows
  • Better member experience

Customer Voice

“The unlimited options for automations… coming from GymSales, that has been the best addition. We were unable to do past due automations before. Gleantap is helping us with automations and also the ability to have AI.”

The Outcome

With Gleantap, Club24 transformed their operations from:

❌ Manual, reactive processes
➡️ ✅ Automated, intelligent revenue engine

Key Takeaways

  • Collections can be automated and optimized – not just managed
  • Even budget gyms can unlock significant revenue gains with the right system
  • Automation doesn’t just save time – it directly drives revenue

Ready to Do the Same?

If you’re running a multi-location fitness business and struggling with:

  • Past due collections
  • Member engagement
  • Manual follow-ups

👉 Gleantap can help you turn these into automated, revenue-driving workflows

AI Lead Qualification: How Conversational AI Replaces Manual Screening

If your team is losing leads to slow responses and inconsistent screening, conversational AI can replace manual screening and stop the leak, a shift that highlights why conversational AI is replacing static forms and funnels. This hands-on guide shows how to implement AI lead qualification and sales automation AI workflows, including copyable SMS and web chat scripts, CRM and booking integrations, scoring rules, KPIs, and governance so you can cut response time, increase qualified lead throughput, and hand off only sales ready prospects to humans. Read on for step by step owners, timelines, and A B tests you can run in a 4 to 8 week pilot.

Why conversational AI beats manual screening for B2C lead flows

Immediate advantage: conversational AI collapses the time between capture and qualification from hours to seconds, and that alone changes outcomes. Research on response velocity and channel engagement underpins this – faster replies raise conversion probability – and many teams see meaningful lift when they automate initial screening. In practice, sales teams using AI have reported up to a 50% increase in leads and appointments as they eliminate slow human triage and catch intent while it is fresh (Salesforce).

Consistency and coverage: automated flows apply the same script, scoring rules, and consent capture 24/7 which removes the common failure modes of manual screening – inconsistent question order, after-hours blind spots, and leads dropping between channels. The tradeoff is upfront work: you must design deterministic rules, tune intents, and accept that some nuance gets lost unless you build deliberate handoff triggers.

Practical limitation: conversational AI is not a replacement for human judgment on complex objections or relationship building. Its real value is reducing noise and routing sales ready leads. This requires reliable integrations – without a synced CRM or CDP your automation will create fragmentation, not efficiency. If your stack lacks tight two-way sync to booking systems like Mindbody or your CRM, plan for that integration first; see how Gleantap features approach this problem.

Concrete Example: a mid-size fitness club routes all web and SMS leads into an SMS-first conversational flow via Twilio. The bot asks name, interest (classes, membership, trial), preferred location, and readiness to start, captures explicit SMS consent, writes those fields to HubSpot, and if the lead score crosses a threshold schedules a trial into Mindbody and notifies a sales rep. Result: same-day bookings rise and staff only handle leads with verified intent and a booked timeslot.

  • Speed wins: catching leads within minutes prevents drop-off that humans rarely beat during busy hours.
  • Predictable qualification: rule-based scoring ensures equal treatment across channels and reduces bias from individual agents.
  • Scale at lower marginal cost: automated screening costs are front-loaded; each additional lead costs cents, not staff hours.
  • Measurable and improvable: you can A/B test opening prompts, scoring thresholds, and handoff triggers and measure lift in booked trials.

Important: prioritize accurate consent capture and clear opt out language in automated SMS and chat flows to protect deliverability and compliance – follow Twilio best practices.

Key takeaway: conversational AI replaces manual screening by accelerating contact, standardizing qualification, and lowering cost per qualified lead – but only if you integrate it with your CRM/CDP and design explicit handoff rules.

Next consideration: pick one high-volume channel to pilot – SMS or web chat – instrument time to first response and qualified lead conversion, and treat early iterations as measurement work not perfection work. If integrations are missing, stop; glueing automation to a fragmented data model is the most common practical failure.

Core conversational AI capabilities you must require

Start here: treat capability requirements as a safety checklist — if the automation stack fails any of these, it will create more work than it saves. For effective AI lead qualification and scalable sales automation AI, insist on capabilities that preserve context, capture consent, and close the loop with your CRM and booking systems in real time.

Capabilities, what they solve, and how to validate them

CapabilityWhat problem it solvesPractical validation
Multichannel orchestration (SMS, web chat, IG DMs)Prevents lead leakage and preserves a single conversation record across channelsSimulate a lead via each channel and confirm a single lead id, transcript, and last-touch timestamp in the CRM
Intent + entity extraction with confidence scoresTurns messy replies into structured fields used for scoring (preferred location, timeframe, party size)Trigger low-confidence paths and verify fallback to human handoff within X minutes
Dynamic qualification & AI lead scoring (rules + ML)Prioritizes leads automatically and reduces false positives sent to repsCompare automated scores to historical conversions on a 500-lead sample before trusting thresholds
Real-time two-way CRM/CDP syncKeeps booking availability, lead status, and consent consistent across systemsCreate a test lead, update a field in CRM, and confirm change reflects in the chat flow within seconds
Seamless handoff with context transferAvoids repeating questions and preserves transcript, score, and consent for agentsMeasure mean time to resolution after handoff and inspect that transcript + score accompany every transfer
Consent capture + rate limiting for SMSProtects deliverability and legal risk; required for SMS-first flowsConfirm explicit opt-in is logged and opt-out flows block future sends
Observability, testing, and versioningAllows A/B testing of prompts, regression testing on intents, and rollback if a change breaks flowsRun a canary test on a subset of traffic and track drop-off and opt-outs before full rollout

Trade-off to plan for: building robust qualification often mixes deterministic rules with ML scoring. Deterministic rules give immediate, auditable behavior for early pilots — use them for booking constraints and legal checks. ML scoring is valuable for prioritization but requires labeled outcomes and ongoing calibration; do not swap in a black-box model for routing until you have at least several hundred labeled conversions and a rollback plan.

Concrete example: a family entertainment center automates party inquiries from Instagram DMs and web chat. The flow extracts party date, headcount, and room preference as structured fields, applies rule-based capacity checks, then runs an ML score that accounts for repeat visits and promo clicks. Leads that pass the threshold get an immediate booking link and a sales-ready flag written to the CRM; ambiguous replies route to staff with the transcript and the model confidence score.

  • Red flag: a system that only writes to CRM asynchronously — real-time updates are non-negotiable for bookings.
  • Red flag: no NLP confidence or no fallback path — low-confidence queries must go to a human, not be auto-classified.
  • Practical check: require opt-in logging visible on the lead record and an automated opt-out suppression list synced across channels.

Action item: before purchasing or piloting any conversational AI, run a 3-day validation script that tests channel capture, one-way and two-way CRM sync, consent logging, and at least three handoff scenarios. If any fail, pause the pilot and fix integration gaps—fragmented data kills conversion lift. See how Gleantap features approach orchestration and consent capture.

Final judgment: vendors often oversell NLP polish. In practice, prioritize tight integrations, auditable scoring, and clear human handoffs over chasing perfect language models. That combination delivers reliable reductions in manual screening time and a measurable increase in qualified throughput for AI-powered sales tools and sales pipeline optimization AI.

Designing the lead qualification model and scoring rules

Treat the qualification model as a decision engine, not a questionnaire. Design it to drive a deterministic action at each score band: immediate schedule, human handoff, nurture sequence, or archive. That focus forces clarity on which attributes matter and how much uncertainty you will accept before routing to a person.

Build scoring from three layers: explicit answers, behavioral signals, and system context.** Explicit answers are things you ask in conversation – intent, start timeframe, budget, location. Behavioral signals come from web activity, email opens, or promo clicks. System context is availability in booking software, past visits in the CRM, and membership status from your CDP. Combine these into a single score but keep the components visible for audits and handoffs.

Scoring components and practical tradeoffs

Practical tradeoff: heavy weighting on explicit answers reduces false positives but misses valuable behavioral intent from browsing or multiple touchpoints.** If you rely too much on behavior, you increase false positives and rep fatigue. Start with conservative thresholds and raise automation coverage incrementally as you validate outcomes.

  1. Core fields to capture: name, contact channel, purchase intent, timeframe to start, preferred location, budget bracket, referral source.
  2. Behavioral signals to include: page views for pricing, repeated promo clicks, email opens, abandoned booking attempts, past visit count from the CRM.
  3. System checks: calendar availability via Calendly or Mindbody, existing membership flags in the CDP, and SMS consent state.
  4. NLP confidence rule: if intent confidence < 0.65 then route to human or run a short clarification step before scoring.

Concrete example: a wellness studio assigns points like +30 for explicit buy intent this week, +20 for a recent pricing page view, +10 for having visited before, and -15 for budget below minimum.** Thresholds: >=60 auto-schedule a trial, 40 59 send a high-touch nurture sequence and alert staff, <40 go into a 14-day drip. After six weeks the team reviews conversion from each band and rebalances weights. This single practice uncovers that repeat visitors with low explicit intent still convert at a rate worth a mid-level score.

ML versus rule based scoring: use deterministic rules for early pilots because they are auditable and easy to tune.** Bring in ML scoring once you have labeled outcomes for several hundred conversions and a process to retrain on a regular cadence. ML helps prioritize within a threshold band but should not be used as a silent gate without explainability and rollback.

Operational considerations that matter: persist score, reason codes, and the last touch timestamp on the CRM lead record.** Make handoff messages contain the score breakdown and NLP confidence so agents focus on the open questions rather than repeating screening. Require an audit log for every automated decision for compliance and model debugging.

Quick checklist: define fields, choose point values, set 3 action bands, require NLP confidence checks, log score + reason codes to CRM, review real conversions weekly, and keep deterministic fallback paths for uncertain cases.

Judgment: teams obsessing over perfect scoring formulas waste cycles.** Practical gains come from visible, auditable scores and ruthless discipline on actions tied to score bands. Expect to iterate weekly during a pilot and to shift weight from explicit answers toward behavior as your labeled dataset grows. For vendor capabilities, validate two-way writeback to your CRM or CDP – see Gleantap features – and confirm calendar integration before relying on auto-scheduling.

Next consideration: after you set initial rules, run a labeled validation on 200 past leads to measure precision and recall for each band before shifting workload from humans to automated scheduling.

Step by step implementation roadmap with owners and timeline

Direct claim: you can move from manual screening to a repeatable, automated AI lead qualification process without a year-long project — if you sequence integrations, conversational design, and pilot measurement in the right order and assign clear owners. Rushing parallel rollouts across locations is the single biggest cause of failure.

Phase plan with owners, timebox, and acceptance criteria

  1. Week 0 — Discovery (Owner: Marketing Ops, 3–5 business days): audit lead sources, identify single pilot channel (SMS or web chat), and lock minimal data schema: leadid, channel, consentflag, score, intent, preferred_location. Acceptance: test file of 20 leads mapped to schema.
  2. Weeks 1–3 — Flow design + QA (Owner: Product/Automation + Sales SME, 2–3 weeks): build core conversational flows, question order, and scoring rules. Acceptance: scripted end-to-end test where a lead completes the flow and the system writes structured fields to the CRM.
  3. Weeks 2–4 — Integrations (Owner: Engineering or Integrations Partner, 1–2 weeks overlapping): implement two-way sync with CRM/CDP, calendar/booking (Calendly, Mindbody, Zen Planner), and messaging (Twilio). Acceptance: a test lead updates booking availability in real time and a change in CRM reflects back to the conversation within X seconds.
  4. Weeks 4–10 — Pilot (Owner: Operations + Sales, 4–6 weeks): run in one location or channel. Monitor lead volume, qualification accuracy, time-to-first-response, and conversion to trial. Acceptance: defined KPI improvement or a hypothesis-driven stop/go decision at week 4.
  5. Weeks 8–12 — Iterate and scale (Owner: Ops + Marketing, 2–4 weeks): tune prompts, scoring thresholds, and handoff triggers, then expand to additional locations. Acceptance: consistent score precision across locations and fewer than Y% opt-outs post-expansion.

Practical tradeoff: choose between integration-first and flow-first approaches. Integration-first reduces risk for bookings and consent but delays customer-facing testing. Flow-first gets quick learning on language and drop-offs but can create data fragmentation if CRM syncs are later bolted on. My recommendation: lock the minimal data contract and consent capture first, then iterate on conversation copy.

Concrete example: a mid-size fitness club assigned Marketing Ops to run discovery in 4 days, Product built a two-question SMS flow in week 1, and Engineering completed HubSpot and Mindbody sync in week 2. The pilot ran in week 3 at a single location using Twilio for messaging and Gleantap for orchestration; by the end of week 6 the team had enough labeled outcomes to raise the auto-schedule threshold and reduce human screening by 60% during peak hours.

Must-have acceptance checklist for each phase: explicit SMS consent logged, real-time CRM writeback tested, NLP confidence fallback defined, booking calendar verified, handoff notification to agents includes transcript + score, and dashboard tracking time-to-first-response.

Operational detail many teams miss: assign a single integration owner with the authority to block rollout until the CRM/CDP contract is stable. Daily standups during the pilot shorten feedback loops and prevent textbook failures where flows work in isolation but create orphan records in the CRM.

Start small, instrument aggressively, and require measurable acceptance criteria at the end of each timebox — that discipline separates pilots that produce repeatable automation from pilots that create more work.

Conversation scripts and templates you can copy now

Cut-to-the-chase templates: below are ready-to-deploy conversation scripts for SMS-first and web chat that prioritize quick qualification, explicit consent, and clean CRM writeback. Practical constraint: every extra question reduces completion rate — design flows to capture the minimum fields that trigger an action (schedule, handoff, nurture).

SMS-first qualification (copy/paste)

How to use: send Message 1 immediately, then branch on replies. Map each answer to CRM fields: intent, availability, start_timeline, consent.

  • Message 1 (auto-reply to form or ad click): Hi [First_Name] — thanks for reaching out to [Location_Name]. Quick check: are you interested in a single class, a membership, or a free intro? Reply 1=Class 2=Membership 3=Intro. Reply YES to opt in to SMS updates. Msgs: 3–5/week. Reply STOP to opt out.
  • If 1/2/3 chosen: Great — what are the best 2 days/times for you this week? Reply like Tue 6pm or Sat 10am.
  • If they give times: Thanks — is this to start within 2 weeks? Reply YES or NO.
  • On YES and available slot: I can lock a spot. Book now: [Calendly/booking link]. I saved your consent on the record.
  • Low-confidence or messy reply: Sorry, I didn’t get that—please type the number that matches your goal (1, 2, or 3), or reply HELP to talk to staff.

Web chat flow for event or birthday bookings

Design pattern: use buttons for common intents to reduce free-text parsing errors. Collect the key booking facts first, then surface availability and price.

  1. Greeting + options (buttons): Book party | Pricing | Hours
  2. If Book party: capture party date, headcount, and room preference using quick replies; validate capacity via booking API before confirming.
  3. If Pricing: show 2 tiered options with a CTA to schedule a walkthrough or request a quote (email capture).
  4. If ambiguous text: run one clarification prompt and, if confidence < 0.6, escalate to human within the workflow.

Follow-up sequence (timing and copy to increase conversion)

  • T+0 (immediate): Sent after initial qualification with booking link and explicit consent note.
  • T+24 hours: Friendly reminder: You left a spot open — still want the Tue 6pm slot? Reply YES to confirm or BOOK to get another time.
  • T+3 days: Value nudge: See how others enjoy their first class — [short testimonial link]. Reply BOOK to schedule.
  • T+7 days: Final soft nudge with opt-out: Still interested? Reply YES or reply STOP to opt out of messages.

Human handoff message template

Send to agent inbox (copyable): New hot lead: [First_Name], channel: SMS, score: [score]. Intent: [intent]. Preferred times: [times]. NLP confidence: [conf]. Transcript: [last 3 messages]. Suggested action: call to confirm and complete booking / follow script #2. CRM link: [open lead].

Concrete example: a wellness studio replaced an email autoresponder with the SMS-first script above, integrated the booking link to Calendly, and moved straightforward scheduling out of staff queues. The team noticed same-day bookings rose and agents spent noticeably less time on initial screening, letting them focus on conversion conversations.

Judgment you should apply: keep early questions binary or multiple-choice and push nuance to later stages. Progressive profiling wins: capture minimal actionable data up front, then use behavior and follow-ups to enrich the record. Too many required fields in Message 1 will tank completion.

Quick implementation checklist: copy templates into your SMS/chat provider, map response tokens to CRM fields, add explicit consent logging, set an NLP confidence cutoff for handoff, and test the entire route from message to calendar booking in a staging environment.

Next step: pick one of these templates, run a 2-week live test with real traffic, and measure completion rate for Message 1 plus time-to-book — treat those metrics as your go/no-go for expanding the flow to more channels.

Integrations, data architecture, and systems to connect

Integrations are the project — not an afterthought. If your conversational AI can answer questions but cannot reliably write a booking, update consent, or change a lead status in the CRM, you have automation that creates more work than it removes.

Design decisions that determine success

Single source of truth: pick one system to own each critical field (consent, booking, lead score). Two systems trying to resolve schedule or opt-out state is the common cause of double books and illegal sends. Prefer CDP/CRM ownership for profile and consent, booking system for availability, and the orchestration layer for conversation state.

Field / EventTypical OwnerWrite pattern
Lead identity and profileCRM or CDP (HubSpot / Gleantap)Master write on create; updates from chat flow via API
Booking availability and reservationBooking system (Mindbody / Zen Planner / Calendly)Read before write; atomic reservation call with confirmation
Consent and opt-outCDP / CRMImmediate write on explicit opt-in/opt-out; propagated to messaging provider
Conversation transcript and eventsOrchestration layer (Gleantap) + archival in CRMEvent stream with webhook fan-out; store last 30 messages on lead record
  • Latency trade-off: Real-time webhooks are essential for booking and handoffs; nightly batches are acceptable for analytics and ML retraining.
  • Idempotency matters: every integration must tolerate retries. Implement request ids and last-applied timestamps to prevent duplicate bookings or score churn.
  • Failure modes to plan for: message delivery failures, booking API rate limits, and conflicting updates from human agents. Build clear rollback and reconciliation jobs.

Concrete example: A six-location studio used Twilio for messaging, Gleantap features as the orchestration/CDP, and Mindbody for scheduling. They set Gleantap as the authoritative lead record, checked Mindbody availability before any Calendly-like link was shown, and wrote an immutable consent flag to the CRM. That prevented double-bookings and ensured every handoff included score, transcript, and consent.

Integrations are fragile in three areas: consent propagation, calendar race conditions, and score ownership. Make these explicit before you route live traffic.

Operational checklist (minimum): define owners for consent/booking/score, require real-time availability checks before showing book link, implement idempotent APIs and dead-letter queues for failed events, and surface reconciliation dashboards that compare chat-derived state to CRM nightly.

Next consideration: before widening the pilot, run a deliberately destructive test (simulated API failures, duplicate requests, and opt-out writes) and verify your reconciliation catches and corrects every class of error without manual surgery.

Metrics, optimization, and governance

Hard measurement wins over good intentions. If conversational automation is going to replace manual screening, you need a small set of operational metrics that trigger decisions, not dashboards that make you comfortable.

Metrics hierarchy — what to watch and why

  1. Accuracy banding (precision / false-positive handoff rate): track what fraction of auto-qualified leads are actually sales-ready when a human reviews them. In B2C scheduling, precision matters more than recall — a high false-positive rate wastes rep time.
  2. Automation coverage and completion rate: percent of inbound leads fully processed by the bot without human intervention, and completion rate for the first two questions. Low completion is often a copy or channel problem, not an AI problem.
  3. Drop-off by step (funnel-level failure rate): measure the proportion of leads who abandon at each question or API call (consent capture, calendar check, booking write). These are your fastest levers for improvement.
  4. Operational latency indicators: CRM writeback lag, booking API round-trip time, and handoff queue wait. Any sustained handoff queue over your SLA is a governance failure, not a product bug.
  5. Safety and trust signals: opt-out rate, SMS deliverability, and NLP low-confidence count. Rising low-confidence or opt-outs are early warning signs of copy or segmentation issues.

Practical trade-off: increasing automation coverage reduces staff hours but raises the volume of edge-case errors and audit work. Expect initial audits to increase; budget 1–2 dedicated hours per week for reconciling system decisions until precision stabilizes.

Optimization practices that actually move the needle

Do experiments that answer operational questions. Don’t A/B test copy in isolation — test copy + threshold + handoff rule together so you know which change cut handoffs or improved bookings.

  • Use holdout cohorts: keep 10–20% of traffic routed to humans for baseline comparison while the rest runs automation.
  • Minimum detectable effect and sample size: plan experiments to detect a 10–15% lift in booked trials; underpowered tests will mislead you.
  • Labeling cadence: tag outcomes (booked, no-show, converted) and retrain ML scoring or re-weight rules every 4–8 weeks using real labels.

Judgment call: add ML prioritization only after you have reliable labeled outcomes. Rule-based routing gets you 70–80% of the gains quickly; ML should be used to fine-tune within bands, not to make silent gate decisions.

Governance checklist — ownership, audit, and compliance

  • Clear owners: assign a single owner for consent state, booking authority, and lead score. One owner prevents conflicting writes and double books.
  • Decision audit trail: persist score, reason codes, NLP confidence, and the last 10 message events on the CRM record for every automated decision.
  • SLA and escalation matrix: define max handoff queue wait, who gets alerted when opt-outs spike, and a runbook for booking API failures.
  • Data retention and privacy rules: centralize opt-out suppression, keep consent records immutable, and align retention windows with GDPR/CCPA requirements; see Twilio SMS best practices for deliverability notes.
  • Change control: require canary rollouts for copy or scoring changes with an automatic rollback if low-confidence or opt-outs exceed thresholds.

Concrete example: a three-location wellness studio tracked a 28% low-confidence rate in weekend inquiries. They introduced a single clarification question and a stricter NLP confidence cutoff, then held a 15% traffic holdout to compare. Within two weeks the false-positive handoff rate dropped by half and same-day bookings increased because reps spent their time on higher-quality conversations.

Action to take this week: assign an owner for lead score and consent, enable a 10–20% human holdout, and instrument precision and drop-off by step. If you cannot capture score and reason codes on the CRM record, pause automation expansion until you can.

Monitoring is governance: without clear owners, autobots create noise. Make measurement and an incident playbook the gating criteria for expanding automation coverage.

Frequently Asked Questions

Practical framing: the questions below are the ones that determine whether conversational AI reduces work or creates more work. Focus on ownership, measurement, and the smallest live test that proves a routing decision.

Will AI remove the need for human sales staff? No. Conversational AI removes repetitive screening and surfaces higher quality, time‑bound prospects. Humans retain the final close for complex objections, negotiation, and high lifetime value opportunities. Design explicit handoff points so agents receive context, score breakdowns, and the transcript to avoid repeating questions.

Which channel should get automation first for fastest returns? Prioritize the channel that both drives the most bookings and supports immediate two‑way actions – commonly SMS for B2C or web chat if it feeds real time availability. The real test is not channel novelty but whether a booking or status update can be written back synchronously to your booking system.

How do I validate the qualification rules are accurate? Run a short pilot with a human holdout and label outcomes. Keep 10 to 20 percent of traffic routed to humans as the baseline, log both automated decisions and final human disposition, and measure precision of the auto-qualified band before you widen automation.

Which integrations are absolutely non negotiable? A single source of truth for profile and consent (CRM or CDP), a booking or calendar system that supports atomic reservations, and a reliable messaging provider for the chosen channel. Without those in place, automation will create orphan records and double bookings.

How do I keep SMS and chat flows compliant? Capture explicit opt in and write it immediately to your consent store, surface clear opt out text in every outbound message, and propagate suppression lists to the messaging provider. Follow Twilio best practices for rate limits and consent handling.

Quick operational wins for the first 30 days: Implement an immediate auto reply that sets expectations and captures a core action field, route any explicitly ready leads to an agent with booking authority, and ensure every transcript and consent flag is written to the CRM on message receive.

How should I set escalation triggers for handoff? Use a mix of score thresholds and signal triggers: score above X, explicit booking request, NLP intent confidence below 0.65, or keywords indicating urgency. Prefer simple numeric thresholds during early pilots and require a human confirmation step for any auto scheduled booking until your reconciliation shows zero race conditions.

Concrete example: A two location dental practice deployed an SMS triage flow that asks for treatment type and urgency, captures insurance status, and checks appointment slots in the scheduling API before offering an immediate booking link. Urgent cases and high score patients were auto scheduled; ambiguous replies were routed to staff with the transcript and score. The practice reduced call volume and freed staff time for cases requiring clinical conversation.

Common misunderstanding: Teams often assume perfect NLP will solve low completion. In practice, completion rises when you reduce friction – use buttons or numbered replies and postpone optional questions. Accuracy comes from good data contracts and a rapid labeling loop, not fancy language models.

Non negotiable action: implement a 10 to 20 percent human holdout, persist score plus reason codes on the CRM record, and log every consent change. Do not expand automation until precision on auto qualified leads converges with your target within two measurement cycles.

Next concrete steps you can run this week:

  1. Run a 14 day pilot on one high volume channel with a 15 percent human holdout and capture outcome labels for each lead.
  2. Lock the data contract: specify owner for consent, lead score, and booking status and test real time writeback to CRM and booking system.
  3. Set three escalation rules – score threshold, explicit booking request, and NLP low confidence – and test each with simulated failures to verify reconciliation.

AI in B2C CRM: Smarter Segmentation, Predictions, and Personalization

If you want to stop guessing who will churn and start prioritizing the customers who matter most, use AI in B2C CRM to turn first-party signals into daily actions. This how-to guide walks through practical predictive CRM models, AI customer segmentation methods, and a 90-day pilot playbook – with feature checklists, evaluation metrics, and channel-ready personalization tactics for fitness clubs, retail, and wellness studios. It also explores CRM Automation for B2C Brands: What to Automate and What to Leave Human, helping you strike the right balance between efficiency and authentic customer engagement. 

1. Business impact of AI in B2C CRM and what success looks like

Immediate business lever: Use predictive CRM to convert scarce outreach resources into measurable retention and revenue gains. In practice that means moving from broad blasts to ranked lists: who to call, who to message, and which offer is justified for each customer segment.

What success feels like: Higher retention for the same marketing spend, fewer avoidable cancellations, and campaigns that show clear incremental lift when compared against holdouts. Success is operational — scored lists feeding daily journeys — not a model sitting in a notebook.

KPIs that tie AI outputs to business value

  • Retention delta: change in monthly churn for the at-risk cohort compared with a randomized holdout
  • Incremental revenue per contacted customer: measured by uplift testing, not absolute revenue after campaign
  • Cost to retain: average incentive or outreach cost per recovered customer versus their projected lifetime value
  • Precision at actionable scale: percent of outreach responses among the top N contacts you can actually service

Practical trade-off: There is a tension between precision and coverage. Tighter thresholds (high precision) mean fewer false alarms but also fewer customers reached; looser thresholds increase scale but raise the cost of wasted incentives and risk customer fatigue. Set thresholds based on your operational capacity and margin per recovered customer.

Data limitation that breaks promises: Fragmented signals across POS, booking, and mobile apps create blind spots that bias churn and CLTV models. Before you trust scores for incentives, ensure your unified profile captures at minimum: last purchase/visit, booking history, channel opt-ins, and membership status. If you cannot unify these, restrict models to use only reliable signals and lower your confidence bounds.

Concrete example

Concrete Example: A regional boutique gym built a churn risk model that scored members daily and fed the top 3 percent into an automated SMS + coach outreach path. Over a 12-week pilot the gym focused incentives on members with higher projected CLTV, recovering a disproportionate share of cancellations while keeping outreach volume within the staff’s capacity.

Judgment call most teams miss: Don’t equate model accuracy with business value. A model with slightly lower AUC but better calibration around high-value customers is more useful operationally. Prioritize calibration and precision@K over global metrics when your budget limits outreach to the top slice.

Key takeaway: Measure AI success by the decisions it enables — daily prioritization, lower cost-to-retain, and clear incremental lift via randomized holdouts. Use a CDP or unified profile as the prerequisite to avoid biased or unusable scores. See product for how unified profiles feed activation.

Start with one operational model (churn or reactivation propensity), prove incremental lift with a holdout, then expand to CLTV and next-best-offer once scoring is stable.

2. AI-driven customer segmentation methods for B2C

Start with the decision you want the segment to drive. Segments that exist only for analysis rarely survive operationalization. Choose a segmentation method based on the downstream action: targeted incentive, cadence change, or product recommendation.

Core segmentation approaches and when to use them

Rule-based segments: Use RFM-style buckets, lifecycle stages, or membership tiers when you need interpretability and simple activation rules. These are low-friction to build, easy for marketing teams to own, and robust when data is sparse.

Unsupervised clusters: Apply k-means, hierarchical clustering, or UMAP + HDBSCAN when behavioral signals are rich and you want discoverable patterns in visits, product choices, or class sequences. Expect to invest time translating clusters into business-readable labels before activation.

Embedding and similarity cohorts: Use product or session embeddings when recommendation or next-best-offer accuracy matters. Embeddings capture sequence and affinity information that tabular features miss, but they increase pipeline complexity and require a vector store or similarity service for realtime lookups.

  • Hybrid approach: Combine rule-based cuts (for clear operational groups) with cluster or embedding overlays to create dynamic cohorts that update automatically.
  • Action-first criterion: Only promote a cluster to production if an owner can name the action (email, SMS, coach call) and the expected business outcome.
  • Refresh cadence: Set segment refresh to match signal velocity; daily for bookings and app events, weekly for transactions, and monthly for static profile changes.

Practical trade-off: Advanced clusters improve targeting but cost more in maintenance and explainability. If your outreach capacity is limited, a handful of high-confidence rule-based segments will outperform dozens of flaky clusters.

Concrete Example: A fitness chain layered a k-means clustering of visit patterns on top of membership tiers. They used the clusters to identify a Weekend-Only cohort and then applied a targeted SMS campaign offering flexible weekday classes; the campaign was run only for clusters where staff capacity could serve additional bookings, avoiding overpromise.

Implementation checklist: Consolidate event and transaction feeds into a customer record, pick one operational segment to automate, validate with a short A/B holdout, and measure action-level KPIs before expanding the segmentation set. See product for prototyping integrations.

Judgment most teams miss: Rich clustering is not a substitute for clear business rules. Treat clusters as discovery tools, then convert the reliable ones into rule-plus-model hybrids for consistent activation and auditability.

Limit the initial segmentation footprint: deploy 3 to 7 operational cohorts you can confidently score and act on, then expand as you measure incremental value.

3. Predictive models to prioritize CRM actions

Prioritization matters more than model perfection. A modestly accurate score that is refreshed daily and directly feeds an outreach queue produces far more retention dollars than an academically perfect model that sits offline. Build models to drive a single decision—who to call, who to message, or which offer to apply—and optimize for that operational constraint.

Model families and the decisions they should trigger

Treat models as decision engines, not research projects. Use classification when the question is binary (will a member cancel this month), regression when you need a dollar estimate (projected 12-month revenue), ranking when you must pick a finite list to contact under capacity limits, and time-to-event models when timing matters (how many days until the likely cancellation). Each family requires different thresholds and monitoring; choose the smallest set that answers your immediate operational problem.

  1. Score then act: Run a daily scoring job, push top N to the CRM task queue, and attach recommended channel and incentive level.
  2. Capacity-aware thresholds: Set thresholds by available outreach capacity and expected conversion rate so you neither waste incentives nor overload staff.
  3. Calibration over global accuracy: Prefer well-calibrated probabilities for decision thresholds; a lower AUC with reliable probability bins beats an overconfident model at scale.

Practical trade-off: Higher model complexity (ensemble trees, embeddings) often improves lift but raises maintenance and explainability costs. If your team cannot investigate why the model ranks a customer, you will undercut trust and slow adoption. Start with transparent gradient-boosted trees for tabular features, then add sequence or embedding layers only after you have an owner for model monitoring and alerts.

Concrete Example: A regional retail chain implemented a no-show propensity ranking for VIP appointment bookings. Features included recent visit cadence, booking lead time, payment history, and prior no-shows. The system scored bookings hourly and pushed the top 8 risky appointments to a small outbound team that offered short, targeted reminders; no-shows fell by 18 percent in the pilot while the outreach team stayed within existing headcount.

Evaluation should combine statistical and business metrics. Track recall@K and Brier score for probability quality, but also measure cost-per-recovered-customer, incentive ROI, and downstream churn reduction. Use a randomized holdout for final attribution rather than relying on historic correlations.

Operational rule: A predictive score is only valuable when it is tied to a concrete action and to your capacity to execute that action. Make the mapping explicit in your CRM and automate the handoff so scores are not ignored. See product for examples of score-to-action workflows.

Prioritize simple, auditable models that integrate with daily workflows; complexity can come later once scoring consistently improves business-level KPIs.

4. Personalization at scale across SMS, email, and app

Direct assertion: Effective multichannel personalization uses the same prediction to decide what to say, when to send it, and which channel should carry it — not three disconnected experiments. When you treat personalization as a single decision surface driven by your predictive CRM outputs, campaigns stop being noisy broadcasts and start becoming prioritized, capacity-aware actions.

Practical constraint: Real-time freshness matters differently by use case. For time-sensitive reactivation an hourly or real-time score is required; for lifecycle nudges daily or weekly batch scoring is sufficient. Choose your scoring cadence to match the decision tempo and avoid wasting engineering effort on real-time pipelines when batch scores would do the job.

Channel, timing, and content — the three knobs to tune

  • Channel personalization: Route high-urgency, high-predicted-value contacts to SMS or phone; use email for rich offers and receipts; reserve push for active app users. Make routing rules auditable and fallback-aware so a missing opt-in triggers the alternate channel automatically.
  • Timing personalization: Use send-time optimization for emails and pushes when you have repeated engagement history; for SMS, prefer behavioral triggers (abandoned booking, missed class) rather than arbitrary hour-of-day heuristics.
  • Content personalization: Swap only the parts that matter operationally — product_name, class_time, recommended_slot, and discount_tier. Avoid hyper-personalized narratives until you have confidence in data quality and consent coverage.

Trade-off to accept: Deep personalization (sequence embeddings, per-customer creative) improves relevance but multiplies testing permutations and makes attribution harder. Start with modular templates and a bounded set of personalization variables; iterate toward more complex models after you can reliably measure incremental lift.

Concrete Example: A boutique fitness chain used its predictive CRM to classify members by reactivation propensity and projected CLTV, then applied a simple routing rule: high-propensity + high-CLTV get an SMS with a credit offer; medium-CLTV get an email with a curated class list; low-CLTV get a low-cost push reminder. The team kept templates minimal, measured incremental lift with a holdout, and adjusted incentive tiers based on conversion efficiency.

Testing and measurement guideline: Run channel-specific holdouts to avoid cross-channel contamination: randomize at the customer level per campaign, not per message. Track both short-term conversion and downstream retention to capture whether a personalized push simply accelerated action or actually increased lifetime value.

Focus first on channel + timing rules driven by your predictive CRM; add deeper content personalization only after you can measure clear incremental ROI.

Compliance and experience note: Always respect channel consent and frequency caps. SMS has higher immediate response but stricter legal and brand risk; maintain explicit opt-ins, provide clear opt-out paths, and cap outreach to avoid fatigue. See product for consent-first activation flows.

5. Implementation roadmap and 90-day pilot playbook

Start with one narrow decision. Run a 90-day pilot that answers a single operational question — for example, which lapsed customers to re-engage this month — rather than trying to solve segmentation, CLTV, and next-best-offer at once. That focus forces simple data requirements, faster model iteration, and measurable business outcomes.

Data minimums matter more than completeness. For a viable predictive CRM pilot capture: canonical customer identifier, timestamped transactions or bookings, event type (purchase/booking/check-in), item or class identifiers, channel opt-ins, membership tier, and last_activity_time_stamp. If you cannot reliably join these within 2 weeks, reduce the pilot scope to features you can trust and treat the rest as exploratory.

90-day sprint: who does what and what gets delivered

TimelinePrimary deliverableAcceptance criteria
Weeks 1-2Ingest and validate data feeds (POS, booking, app events)Unified profile with join key, 90 days of clean events, opt-in flags verified
Weeks 3-4Define target segment and baseline metric; build control logicRandomized holdout prepared; baseline KPI computed
Weeks 5-8Train and validate model; produce daily scoring jobModel produces calibrated scores; precision@K tested on historical fold
Weeks 9-12Activate campaign and measure incremental liftCampaign runs to scored cohort; randomized holdout shows measurable lift or a clear next-step signal

Practical trade-off: choose speed over model complexity for the first pilot. A transparent tree-based model or vendor-provided propensity model deployed in days will usually surface actionable customers faster than a deep sequence model built over months. If the pilot fails to move the metric, you learn faster with a simple model and can invest in complexity with clearer requirements.

Team handoffs, in practice: assign a single delivery lead who owns scope and cadence, pair CRM ops with an analytics owner to approve scoring thresholds, and route compliance/signals from legal into the activation workflow. Outsource model construction if you lack capacity, but keep activation and A/B decision rules in-house so campaign ownership is clear.

Concrete Example: A family entertainment center ran a 90-day pilot to lift repeat bookings. They ingested two months of POS and booking logs, trained a LightGBM reactivation propensity model using recency, visit frequency, average spend, and booking lead time, and scored customers nightly. The activation targeted the top 200 scored lapsed families with a time-limited coupon via SMS, using a randomized 25 percent holdout to measure incremental weekly visits over eight weeks.

Measurement nuance: do not rely on headline accuracy alone. Require a holdout at the customer level, pre-register the primary KPI and analysis window, and guard against seasonality by running the pilot long enough to include typical business cycles. If your sample is too small for frequentist significance, use Bayesian sequential methods to decide earlier.

Key action: Start with one decision, ship a simple, auditable model, automate nightly scoring into your CRM, and use a randomized holdout to prove incremental lift before scaling. Use product integrations for profile unification and activation.

Next consideration: before you expand, confirm you can operationalize scores daily and that outreach volume matches staffing capacity — otherwise scaling will amplify mistakes rather than gains.

6. Measurement, governance, and model maintenance

Direct point: Measurement has to prove causality, not correlation. Scores that look sensible but were never validated with randomized holdouts create false confidence and expensive outreach decisions.

Measuring impact the right way

What to pre-register: pick the primary KPI (monthly churn, incremental visits, or revenue per contacted customer), the unit of randomization (customer_id), the evaluation window, and the minimum detectable effect before you run the campaign. Do this before you tune anything.

Practical trade-off: small operations usually cannot power statistically significant experiments across many segments. Use prioritized holdouts (larger control groups for higher-uncertainty segments) or Bayesian sequential methods to reach decisions faster without overcommitting incentives.

Operational monitoring and maintenance

  • Pipeline health: track ingestion latency, rate of missing features, and join success for the canonical customer identifier so a broken feed does not silently poison scores.
  • Performance checks: watch task-level metrics such as top-K precision, conversion lift in recent campaigns, and a simple business metric (cost-per-recovery) rather than just AUC.
  • Drift signals: monitor both feature distribution shifts and label-rate shifts; trigger a retrain only when business lift degrades or drift persists beyond a tolerance window.
  • Deployment safety: use shadow scoring, canary rollouts, and manual overrides. Never flip a production model without a short canary and a rollback plan.

Limitation to accept: retraining on a calendar without checking for drift wastes resources and can amplify recent anomalies (holiday spikes, pricing promotions). Tie retraining to monitored degradation and to operational readiness — retraining is an organizational workflow, not just a data job.

Concrete Example: A wellness studio saw predicted reactivation probabilities fall after it introduced a new membership tier. Instead of immediate retraining, the team ran a two-week canary: they shadow-scored 10 percent of customers with the retrained model, compared conversion lift against the incumbent, and only promoted the new model after the canary showed a sustained 12-day improvement in conversion. This avoided a full rollout that would have increased incentive spend without benefit.

Governance checklist for production CRM models

  • Owner and model card: assign a single business owner and publish a model card describing purpose, inputs, known limitations, and retrain triggers.
  • Consent and minimization: ensure consent flags are authoritative in the profile store and store only the PII required for the decision flow; link to consent flows in product.
  • Audit trail: log scores, actions taken, and incentive levels for every contact so you can replay decisions for compliance and analysis.
  • Bias and safety tests: run simple demographic parity and outcome checks quarterly and require human review before any high-incentive policy change.

Must-have control: a score registry with a model card and automated alerts. If you cannot answer which model produced a score, when it was last retrained, and who owns it, pause expansion.

Judgment call: many teams over-focus on global accuracy metrics. In practice, model usefulness is measured by the decision it improves under operational constraints: staffing, incentive budget, and channel consent. Prioritize explainability and auditability over incremental lift from a black-box model if you want campaigns to scale.

Start monitoring with two alerts: broken data joins and sustained drop in business lift. Everything else can wait until those are stable.

Next consideration: assign a model owner, instrument the two alerts above, and require a canary window and holdout check before any full production model replacement. That governance prevents costly rollout mistakes and keeps predictive CRM reliable as you scale.

7. Practical playbook for a fitness club: step-by-step example

Quick assertion: Run the pilot as a constrained decision problem: identify who to rescue this month and what single action will be taken when the model flags them. Narrow scope beats ambition in early deployments.

Objective, scope, and data inputs

Objective: Reduce avoidable monthly cancellations by prioritizing outreach to the members most likely to respond and who have meaningful future value. Pick one operational KPI to optimize — for example, cancellations avoided per outreach.

Minimum data inputs: a canonical member_id, timestamped check-ins/bookings, membership tier, recent payments, last interaction channel and opt-in flags, class booking patterns, and basic demographics. If your POS and booking feeds cannot be joined reliably, shrink the pilot to features you can trust immediately.

Step-by-step playbook (6 steps)

  1. Step 1 — Define the decision rule: Choose the action you will take when someone is scored as at-risk (example: automated SMS offering a one-time class credit + coach follow-up). Keep incentives tiered by expected lifetime value.
  2. Step 2 — Build the training set: Label historical cancellations within a fixed horizon (eg, cancel within 30 days of the score window). Include at least 60 days of feature history per member and hold out the most recent 30 days for validation.
  3. Step 3 — Model choice and features: Start with a gradient-boosted tree (LightGBM/XGBoost) using recency, booking cadence, payment lapses, class mix, channel response history, and membership tier. Add simple engineered features like consecutive missed classes and time-since-last-booking.
  4. Step 4 — Scoring cadence and thresholds: Score nightly and push the top N members to the CRM queue where N is set by human follow-up capacity. Calibrate probabilities into bins and choose the action threshold by expected ROI per contact, not by raw AUC.
  5. Step 5 — Activation and control: Automate the SMS/email templates with variable fields (class_name, coach_name, credit_amount) and route high-value members to concierge calls. Randomize a control group at the member_id level to measure incremental impact.
  6. Step 6 — Monitor and iterate: Track conversion-per-contact, downstream retention over 8 weeks, staff follow-up rate, and incentive cost-per-retained-member. If conversion drops or feature joins fail, pause the automated incentives and run a canary.

Practical trade-off: Aggressive thresholds recover more members but inflate incentive spend and risk training staff beyond capacity. If you lack reliable joins across systems, be conservative: prefer outreach with no-cost nudges first and reserve credits for the highest-confidence bins.

Concrete Example: A metropolitan boutique gym used nightly scores to identify members with falling booking cadence and unpaid renewals. They routed the top-scored tier to an SMS offering a single class credit and a calendar link; the top 10 percent also received a coach call. The pilot used a randomized holdout to show incremental retention among contacted members and kept follow-up volume within the existing front-desk capacity.

Pre-register these metrics: primary KPI (cancellations avoided per 1,000 contacts), unit of randomization (member_id), evaluation window (8 weeks post-contact), and operational KPIs (outreach conversion rate, staff follow-up completion). Record these before you tune any thresholds.

Judgment most teams miss: Model outputs must map to an executable human workflow. If the CRM task queue, coach availability, or redemption flow breaks, even a high-quality score is worthless. Keep a human-in-loop for high-incentive actions until your playbook is repeatable.

Next step: run a short smoke test (about six weeks) to validate joins, scoring cadence, and operational handoffs before committing to a longer pilot or larger incentive budget. If the smoke test fails, fix data and workflow issues rather than retraining the model.

Frequently Asked Questions

Direct point: These are operational answers — not theory. Each response ties an AI capability to a decision you must make about data, cadence, channel, or measurement.

What data do I need to start using AI in B2C CRM effectively: Consolidate a canonical customer identifier plus timestamped transactions or bookings, recent engagement events (app opens, class bookings), channel opt-in flags, and membership or loyalty attributes. If joins fail, reduce the model scope – train on features you can join reliably and treat the rest as future enhancements. See product for common ingestion patterns and consent capture.

Which predictive model gives the fastest ROI for B2C businesses: Models that predict churn or reactivation propensity usually return value fastest because they feed immediate outreach decisions. Practical caveat: a propensity score is only valuable if you can act on the top-ranked customers within your operational capacity – otherwise you create false positives and waste incentives.

Real use case: A small retail chain scored lapsed shoppers for reactivation and sent a time-limited SMS coupon to the top 3 percent. Because they limited outreach to customers who historically redeemed SMS offers, the pilot recovered significantly more revenue per sent message than previous blanket discounts.

How do I measure whether AI-driven personalization increased revenue: Use randomized holdouts at the customer level, pre-register the primary KPI and window, and measure incremental lift rather than absolute lift. Track both short-term conversion (redemption, booking) and medium-term retention or CLTV to detect whether the personalization accelerated behavior or truly increased value.

How often should predictive models be retrained: Tie retraining to observable change signals – not a calendar alone. Retrain when you detect feature distribution drift, label-rate shifts, a product or pricing change, or sustained drop in conversion lift. For many B2C pilots that means monitoring weekly and retraining on demand, with a fallback cadence of roughly monthly for stable businesses.

What governance practices are essential when deploying customer-facing AI: Require an owner and a short model card, explicit consent flags in the profile store, logged score-to-action decisions, and a spend cap on incentives that triggers human review. Insist on a canary rollout for any model that changes incentive levels to avoid runaway costs.

Can small businesses without a data science team use AI-driven CRM: Yes, provided they solve the data-join and consent problem first. Many vendors supply prebuilt propensity models and activation workflows; the critical in-house tasks are owning the customer joins, managing thresholds by capacity, and running the randomized holdout.

Concrete example: A neighborhood wellness studio used a vendor propensity model to score lapsed clients, then automated an SMS with a complimentary session for the top bin while tracking a 20 percent holdout. The team avoided hiring data scientists and focused on operational execution – staffing follow-up and measuring incremental visits.

Which channels perform best for reactivation messages in B2C CRM: Channel effectiveness depends on customer preference and consent history. SMS converts fastest for time-sensitive offers but carries higher legal and brand risk; email works for richer, lower-urgency personalization. My judgment: build a channel-preference score from past response rates and route accordingly rather than assuming SMS is always best.

Practical next actions: 1) Verify canonical joins and consent for 90 days of events; 2) Run a small churn/reactivation pilot using a vendor or simple LightGBM score; 3) Pre-register KPI, randomize a 20-30 percent holdout, and limit incentive spend with a human approval gate. These three moves reduce technical risk and force clear measurement.

Data Privacy and Compliance in Customer Data Platforms

CDP data privacy is the gatekeeper between useful personalization and regulatory, financial, and reputational harm. This practical guide shows heads of marketing, product, and ops at B2C businesses how to evaluate, configure, and operationalize privacy and compliance controls in a CDP by mapping legal obligations to vendor features, technical checks, and operational runbooks. You will find concrete checklists, vendor verification tests, and step-by-step workflows for consent orchestration, automated data subject requests, field-level protections, and residency controls so you can centralize customer data safely and lower compliance risk. It also explains why a Customer Data Platform is the foundation of omnichannel engagement—unifying customer data across touchpoints to enable consistent, personalized experiences at scale while maintaining compliance.

Regulatory landscape most relevant to B2C CDPs

Plain fact: compliance obligations dictate CDP architecture decisions, not the other way around. CDP data privacy requirements determine what you can ingest, how long you store attributes, what profiling is allowed, and which downstream activations are lawful. Treat legal regimes as engineering constraints during vendor selection and implementation.

Core laws and the specific obligations that matter for CDPs

  • GDPR (EU): Lawful basis for processing, purpose limitation, data minimization, retention limits, and enforceable data subject rights that require export, rectification, and erasure capabilities.
  • CCPA / CPRA (California): Consumer rights to access, deletion, and opt out of sale or sharing – impacts profiling, data mapping, and consent-or-opt-out enforcement for targeted advertising.
  • HIPAA (US health sector): If the CDP processes protected health information on behalf of a covered entity or business associate, technical and contractual safeguards apply including BAA requirements.
  • Brazil LGPD: Similar to GDPR on lawful processing, with extra emphasis on cross border transfer rules and local authority cooperation.
  • APAC PDPA variants: Often focus on consent and notice; regional deployments or pre-ingest filtering reduce transfer risk.

Sector triggers and tradeoffs: collecting a health attribute for personalization can convert ordinary PII into regulated PHI under HIPAA – the practical tradeoff is between richer personalization and much greater contractual and technical burden. Likewise, collecting childrens birth dates or account details for family entertainment center loyalty programs may trigger COPPA-like obligations which demand parental consent and stricter retention.

Concrete example: A midmarket fitness chain collecting wearable heart rate data and medical notes for class recommendations must decide if that data will live in the CDP. If medical staff or a partnered clinic also manages those records, HIPAA likely applies and the operator must use a CDP deployment with a BAA, field level encryption, and strict access controls. Without that, ingesting the data exposes the business to regulatory and contractual risk.

  • Use case – GDPR, fitness club: Consent must be explicit for profiling that uses health adjacent signals. Implementation requires recording consent version, linking consent flags to profiling engines, and honoring opt outs across marketing destinations.
  • Use case – CCPA, retail loyalty program: Consumers can request portability or deletion of their loyalty profile. The CDP must support unified export and an erasure cascade to downstream ad partners and CRM systems.
  • Use case – HIPAA, healthcare clinic: The CDP must operate under a BAA, segregate PHI fields, and log every access. Profiling for treatment coordination may be allowed, but marketing activations are curtailed by PHI rules.

Key judgment: Vendor claims of being compliant are not sufficient. Insist on evidence – current SOC or ISO reports, a signed DPA or BAA where relevant, and testable technical controls like field level encryption and deletion APIs.

Action items: evidence to collect per law – Maintain a packet for auditors and vendors that includes: 1) a lawful basis mapping spreadsheet for GDPR/LDGP, 2) data inventory export from the CDP showing schemas and retention tags, 3) retention policy documents, 4) vendor DPA or BAA, 5) proof of consent capture and stored versions, and 6) sample audit logs showing DSR completions. Use these during procurement and quarterly reviews.

Mapping privacy principles to CDP architecture

Practical rule: map every legal privacy principle to a specific CDP control before you start sending production events. Treat principles as engineering tickets with acceptance criteria, not as high‑level policy statements.

Core mapping: principle -> CDP feature -> what to test

Privacy principleCDP architectural controlOperational step to validateReal world tradeoff
Data minimizationSchema gating and selective ingestion rulesAttempt to ingest a superset event; verify the CDP rejects or strips fields marked forbiddenReduces analytic breadth; expect some loss in signal for micro‑segmentation
Purpose limitationAttribute purpose tags + destination gatingCreate attribute with purpose marketing; try to forward to analytics and advertising destinations and confirm enforcementAdds mapping overhead; requires ongoing governance to keep purpose tags accurate
Retention limitsPer‑attribute retention metadata + automated deletion jobsSet short retention on sensitive fields; run deletion job and verify downstream cascadeFrequent deletes increase complexity for historical reporting and long‑term modeling
AccuracyData lineage, reconciliation jobs, and writeback mechanismsIntroduce corrected value upstream; confirm CDP updates unified profile and logs change eventWritebacks can cause sync conflicts with legacy systems; define master record rules
AccountabilityImmutable audit logs, access controls, and DPIA links to schemasReview an access log for a sample profile and trace it to a DPIA entryAudit tooling is often verbose; invest in searchable log retention to make audits practical

Key operational insight: gating at ingestion is the highest‑leverage control. If you prevent sensitive or out‑of‑scope attributes from entering the CDP, you avoid a cascade of downstream controls, complex deletion workflows, and expensive contractual obligations such as BAAs.

  1. Implement purpose tags first: add a purpose column to your CDP schema and require product owners to declare purpose before new attributes are accepted.
  2. Automate retention enforcement: schedule deletion jobs per attribute rather than per table so you don’t have to rebuild retention logic when schemas change.
  3. Test downstream enforcement: during onboarding run integration tests that exercise advertising, CRM, and analytics destinations to confirm purpose/consent flags block or allow flows as intended.

Concrete example: A regional retail chain used purchase velocity and in‑store Bluetooth location events to predict churn. They added a purpose tag indicating analytics only, configured the CDP to block forwarding of location events to ad networks, and set a 30‑day retention on raw location pings. The result: the predictive model kept enough signal to work while advertising partners never received raw location data that could be re‑identified.

Practical checkpoint: at vendor selection demand a demo where the vendor: 1) shows schema purpose tagging, 2) runs an ingestion that is selectively stripped, 3) executes an attribute deletion and shows audit evidence. If any step is manual in the demo, treat it as a missing feature.

Judgment: purpose tags and ingestion gates are necessary but insufficient; enforcement must be verified across every downstream integration and surfaced in audits. Vendors often show tagging UI but fail to demonstrate automated enforcement — that is where most CDP data privacy failures occur.

Technical controls to require from a CDP vendor

Insist on testable, contractual controls — not feature promises. For practical CDP data privacy you must convert each security or privacy claim into a concrete capability you can verify during procurement and after go‑live. Vendors commonly market broad terms like privacy‑first or encrypted; your job is to force those into measurable requirements and acceptance tests.

Core technical controls to demand

  • Customer‑managed keys (BYOK): vendor supports BYOK with integration to your KMS, documented key rotation, and proof that keys can be revoked to render stored blobs unreadable.
  • Field‑level encryption and tokenization: ability to encrypt or tokenize sensitive attributes at ingestion so raw values never appear in logs or downstream destinations.
  • Deterministic vs non‑deterministic hashing: support both modes with salt management; require proof that deterministic salts are isolated and rotated securely.
  • Attribute‑level RBAC and policy engine: enforce who can read, write or activate specific attributes; policies should respect consent flags at enforcement time, not just in UI.
  • Immutable, searchable audit logs: append‑only logs with tamper evidence, exportable to SIEM for correlation and long‑term retention.
  • Deletion and erasure APIs with cascade evidence: programmatic erase that returns verifiable receipts when data is removed from the platform and downstream partners.
  • Regional data residence controls: selectable storage regions or pre‑ingest filtering so you can avoid cross‑border transfer entirely for sensitive cohorts.
  • Secure connector framework: vetted outbound connectors with allowlist controls and runtime validation to block unauthorized destinations.

Practical tradeoff: field‑level encryption and BYOK materially reduce exposure but increase latency, CPU cost, and operational complexity for analytics pipelines. Pseudonymization preserves analytic joins at much lower performance cost, but it requires a secure, auditable re‑identification workflow and stricter access controls. Choose based on whether you need live re‑identification or only aggregated analytics.

Concrete example: A midmarket healthcare clinic configured a CDP to pseudonymize patient identifiers for modeling while keeping PHI fields encrypted with customer‑managed keys. Analysts ran cohort queries without access to raw identifiers; clinicians accessed re‑identification through a logged API that required service account MFA and returned a signed audit entry for every lookup.

Verification checklist for procurement and audits

  1. Request a short demo that performs a live field encryption ingest, then shows latency and CPU metrics for that flow.
  2. Obtain a signed sample audit log and verify it contains read/write events with immutable sequence IDs you can import into your SIEM.
  3. Ask for a scripted DSR run: submit an erasure via API and receive a deletion receipt plus downstream webhook confirmations within the stated SLA.
  4. Validate salt/key rotation: vendor shows key rotation logs and demonstrates that rotated keys prevent decryption of newly revoked exports.
  5. Confirm regional deployment: vendor provides account topology diagram showing separation between regions and a plan for segmented backups.

Clause to insist on in the DPA: BYOK support or equivalent key controls, deletion SLA and receipts, audit rights with sandbox access, 30 day subprocessor change notice, and breach notification within 72 hours. Get SOC or ISO reports as evidence and require periodic replayable tests of DSR and deletion flows.

Takeaway: make controls contractually required and operationally verifiable. Plan for the performance and analytics tradeoffs up front, and require vendors to demonstrate the exact APIs and proofs you will rely on for audits and DSRs. For guidance on evidence to request, see Gleantap security and baseline legal references like GDPR overview.

Operational governance: processes, contracts, and evidence

Operational governance determines whether CDP data privacy is auditable or accidental. Good controls are operational artifacts you can point to under pressure—signed DPIAs, reproducible deletion receipts, a consent ledger export—not slogans on a vendor website.

Start by treating governance as a delivery stream: product, legal, security, and ops own discrete deliverables with SLAs. If you leave ownership fuzzy, remediation becomes firefighting. Assign a single custodian for the CDP evidence folder and require change notifications before any schema or connector change.

Core processes to implement first

  1. Evidence pipeline: Define how artifacts flow into a shared evidence store (DPIA PDFs, executed DPAs/BAAs, sample audit logs, deletion receipts).
  2. Change gating: Require a privacy ticket with purpose tag, retention tag, and risk score before accepting new attributes or destinations.
  3. Access lifecycle: Automate role reviews and require justification for attribute-level access; revoke after project completion.
  4. DSR orchestration: Route intake to an automated DSR tool and require the CDP to return a signed completion token for every request.

Tradeoff to accept: stricter gates slow product experiments. The right pattern is risk‑based gating: fast path for safe attributes, full review for sensitive or regulated fields. That preserves velocity while preventing costly exposures.

Artifacts auditors will actually ask for

  • A replayable test script that demonstrates a deletion request from intake to downstream receipts (timestamps and webhook logs).
  • A sample consent ledger export with version, source URL, IP, and consent string or reference to CMP records.
  • Proof of key control: KMS configuration snapshot showing which keys protect which buckets and evidence of rotation events.
  • Recent access review report showing attribute owners and approvals, plus a changelog for each approval.

Concrete example: A family entertainment center added a birthday‑party signup form that captures childrens age. They implemented a parental verification step, blocked that cohort from ad destinations via a pre‑ingest filter, stored consent records linked to the sign up form URL, and kept a deletion audit for parental requests. That set of artifacts made a regulator audit straightforward and avoided a disruptive product rollback.

Common misstep: teams assume the CDP vendor will handle governance work. In practice vendors provide primitives; you must build the runbook, test scripts, and contractual obligations that turn those primitives into defensible evidence. Insist on replayable demos during procurement—ask vendors to run your script, not theirs.

90‑day governance sprint priorities: 1) Lock an evidence folder and ingest baseline artifacts, 2) Implement a change gate for new attributes, 3) Automate one DSR flow end‑to‑end and capture deletion receipts.

Next consideration: after you have processes and artifacts, schedule quarterly dry runs that simulate regulator requests and post‑mortem any gaps—this is where governance converts into lasting compliance, not just a binder on a shelf.

Consent and preference orchestration with CMPs

Make the CMP the canonical consent ledger and the CDP the enforcement layer. Treat the consent management platform as the source of truth for who agreed to what, when, and under which terms; the CDP’s job is to consume that signal and enforce it across schemas, destinations, and downstream jobs.

Practical nuance: consent is not a single boolean. You need per-purpose, per-channel, versioned records with provenance (capture URL, IP, timestamp) and a durable reference to the CMP record. IAB TCF strings are useful for programmatic advertising but do not replace first-party consent flags you use for direct email, in-app messaging, or health‑adjacent processing under GDPR or HIPAA. Map both, but do not conflate them.

Five integration checkpoints

  1. Capture: store a consent object at point of capture that includes purpose IDs, version, and a CMP reference ID rather than only toggling a profile field.
  2. Persist: write consent as an append‑only ledger in the CDP with timestamp and source so you can reproduce state at any historical moment for audits.
  3. Map: translate CMP purposes to CDP attribute and destination policies; maintain a mapping table that product owners can update with approvals.
  4. Enforce: gate destinations at activation time using the current consent state; prefer real‑time webhook enforcement for ad networks and queued enforcement for batch exports.
  5. Audit & recover: emit deletion/deny receipts, record enforcement decisions, and keep a replayable log so you can demonstrate compliance or roll back an activation.

Tradeoff to accept: strict real‑time enforcement increases architectural complexity. Blocking at ingestion is safest but reduces flexibility for retrospective analytics. If you choose post-ingest enforcement, build robust backfill and rollback flows and accept the longer verification window for revocations.

Concrete example: A regional fitness chain uses OneTrust to capture two consents on class sign‑up: one for marketing and one for sharing anonymized attendance with partner analytics. The CMP writes a versioned consent record; the CDP ingests that record, tags attendance events with the consent version, and blocks any export of raw attendance or health signals to ad platforms unless the marketing consent is present. When a member revokes marketing consent, the CDP immediately stops activations and issues a deletion receipt for any queued exports.

Judgment: dashboards are nice, but what matters in audits is machine‑readable evidence. Demand API‑first flows: webhooks for change events, exportable consent ledgers, and enforcement receipts. During procurement, require vendors to run your script that simulates capture, revocation, and downstream blocking — accept nothing less than replayable proof.

Key takeaway: design consent as data: capture versioned CMP records, persist an append‑only ledger in the CDP, map purposes to enforcement policies, and require replayable logs and receipts to prove compliance. For legal context, see GDPR overview and confirm vendor controls against your evidence folder in Gleantap security.

Automating data subject rights and request orchestration

Direct point: automation of data subject requests is not optional for reliable CDP data privacy — it is the operational core. Manual DSR handling scales poorly, creates audit gaps, and is the usual cause of regulator findings. An automated pipeline reduces human error but only if it ties identity verification, cataloged connector behavior, and verifiable receipts together into a single runnable workflow.

Core technical and operational controls

What to require: a CDP deployment that supports programmatic erasure and export via APIs, an indexed mapping of which attributes live in which downstream systems, append-only receipts for every action, and integration points for DSR orchestration platforms such as Transcend, Securiti, or OneTrust. Add an anti-fraud verification step, rate limiting, and a reconciliation engine that proves a cascade completed successfully.

  1. Step 1 – Intake and verification (SLA: 0-4 hours): accept requests through verified channels, run identity proof checks or OTP flows, and tag the request with a confidence score before processing.
  2. Step 2 – Locate and map (SLA: 1-2 hours): query the CDP for the canonical profile plus a connector inventory showing which downstream systems hold related records; produce a runnable execution plan.
  3. Step 3 – Prepare execution units (SLA: 1 hour): split the request into atomic tasks (export profile, erase PII, redact event history), queue tasks with connector-specific parameters and safety checks.
  4. Step 4 – Execute with transactional receipts (SLA: same day for most connectors): call DELETE or erase APIs, or run allowlisted retention jobs; collect signed receipts or webhooks from each destination.
  5. Step 5 – Reconcile and escalate (SLA: 24-72 hours): compare expected versus actual receipts, surface failures for manual resolution, and produce an audit package that includes timestamps, requestor verification, and receipts.
  6. Step 6 – Aftercare and system hygiene (SLA: 72 hours): tombstone identifiers, refresh models that used the data, and mark downstream cached artifacts for purge or aggregation review.

Concrete example: A regional fitness chain receives a portability request that includes class attendance and email history. The intake system verifies identity via a linked phone OTP, the CDP maps the profile to CRM, email provider, and ad partner connectors, and the orchestration engine issues exports for portability while sending DELETE calls to the email provider. The system returns a signed deletion_receipt for the email provider webhook and a consolidated JSON bundle for the member within 24 hours.

Tradeoffs and limits: full cascade erasure depends on third parties supporting programmatic deletion. Expect gaps with legacy partners; plan for legally defensible compensating controls such as pseudonymization, tombstoning, or contractual deletion commitments. Also accept some friction: stronger identity verification reduces fraud but increases request friction and SLA pressure. In practice the biggest failure mode is proof generation — if you cannot produce machine readable receipts, you have not automated the DSRs.

Actionable demand for procurement: require vendors to run your DSR script during the POC, produce deletion_receipt tokens and connector webhooks, provide a connector inventory API, and supply a replayable audit package. For legal context and evidence templates consult GDPR overview and your vendor evidence folder such as Gleantap security.

Data residency, cross border transfers, and evidence for auditors

Hard choice, practical consequences: pick a residency approach up front because it changes contracts, architecture, and the evidence you must produce. CDP data privacy is not solved after go‑live; it is enforced through region‑by‑region design choices and repeatable proofs that an auditor can verify.

Residency approaches that actually work in production: deploy vendor tenancy in the target region, maintain separate cloud accounts per region, or filter and pseudonymize data before it leaves the source. Each option trades cost, latency, and analytic completeness: regional tenancy costs more but minimizes transfer controls; pre‑ingest filtering is cheapest but removes cross‑border features.

Cross‑border transfer mechanisms and what auditors will check

Standard mechanisms include Standard Contractual Clauses (SCCs), Binding Corporate Rules (BCRs), and adequacy decisions. Auditors will not accept high‑level references — they want the executed legal texts (signed SCC annexes or BCR approval), plus a transfer impact assessment that shows how access by foreign authorities or subprocessors is mitigated.

Common misconception: strong encryption alone rarely eliminates transfer obligations. If your CDP vendor or their key custodian is outside the originating jurisdiction, regulators will treat transfers as occurring unless technical and contractual barriers demonstrably prevent re‑identification and access.

Operational tradeoff to plan for: enforce local storage and backups to reduce regulatory risk, but accept increased engineering work for cross‑region joins and longer maintenance windows. Alternatively, centralize analytics under consented cohorts and keep raw PII local — this preserves models while reducing legal exposure, but requires robust pseudonymization and a secure re‑identification process.

Concrete example: a pan‑EU retail group routed EU member profiles into an EU‑only CDP tenancy and used SCCs for a US‑based analytics provider. They pseudonymized identifiers before export and retained key material in an EU KMS. During audits they presented the executed SCC annex, the KMS config showing EU key residency, flow logs proving routing rules, and sample deletion receipts for erased exports — this combination satisfied both technical and contractual checks.

What auditors actually ask for (not what sales decks show): network and routing logs with timestamps, signed transfer clauses, sub_processors register with change notices, KMS snapshots with key owner details, backups and DR topology by region, DPIAs and transfer impact assessments, and sample execution evidence such as deletion receipts and connector webhooks.

Audit evidence checklist: executed SCCs/BCRs, DPIA + transfer impact assessment, architecture diagram with region labels, KMS configuration export, backup/DR location proof, sub_processors list with 30 day notice clause, sample deletion/export receipts, and connector routing logs. Request these artifacts in the RFP and include them in the DPA.

Judgment: make transfer controls contractual and observable. Put residency and key‑holding clauses in the DPA, require automated routing tests in the POC, and enforce a quarterly verification cadence. Without those steps, you buy a feature set, not a defensible compliance posture.

Next consideration: decide the residency policy before finalizing the vendor DPA and make proof artifacts a non‑negotiable part of your acceptance tests — auditors will want the artifacts, not assurances.

Vendor selection scorecard and phased migration checklist

Hard requirement: convert CDP data privacy into a measurable vendor scorecard and a phased migration plan before any contracts are signed. Vendors sell capability stories; your job is to translate those stories into weighted criteria, POC scripts, and contract clauses that prove the claims under pressure.

Vendor scorecard with verification steps

CriterionWeightPOC verification stepContract clause to require
Privacy controls (field level encryption, BYOK, DSR APIs)30%Ingest a sensitive attribute, request a DELETE via API, and produce deletion_receipt plus downstream webhook confirmationsBYOK support, deletion SLA with receipts, audit rights
Integrations and enforcement (CMP, ad networks, CRMs)20%Simulate consent capture, revoke consent, and show real time blocking for at least three destinationsSubprocessor list, 30 day change notice, enforcement guarantee
Operational features (audit logs, RBAC, DSR orchestration)15%Run role based access test and request a sample immutable audit log export for a profileImmutable log export rights, SLAs on access review support
Total cost of ownership (licensing + egress + engineering)15%Present a cost projection for a 12 month run including estimated egress for backups and analytics joinsTransparent billing terms and egress caps
Support, SLAs, and responsiveness10%Time a support runbook execution in the POC and measure response and remediation speedSLA with escalation path and remediation credits
Certifications and audits (SOC2, ISO, DPIAs)10%Request the latest audit reports and confirm they cover the specific tenancy you will useProvide recent SOC/ISO reports and DPIA templates

Practical insight: weighting matters because the highest privacy value often reduces product velocity. If you give privacy controls an outsized weight you will pay in latency and engineering time. If you underweight them you will inherit audit and legal friction. Choose weights that match your highest risk vectors – for example a healthcare adjacent operator must bias toward privacy controls and certifications.

Phased migration checklist

  1. Phase 0 – Discovery and RFP: catalogue sensitive fields, map regulatory triggers, and send the scorecard plus a runnable POC script to shortlisted vendors.
  2. Phase 1 – POC with synthetic or anonymized data (2-4 weeks): execute the POC script that includes ingest, field encryption, consent revoke, DSR DELETE, and audit log export. Accept only vendors that run your script verbatim.
  3. Phase 2 – Pilot parallel run (4-8 weeks): run a small live cohort in parallel to production with full observability on consent enforcement and DSR completion rates; measure DSR SLA and consent enforcement rate as success metrics.
  4. Phase 3 – Cutover and monitor (1-2 weeks): switch traffic for defined segments, monitor failure and rollback criteria, keep previous pipeline hot for 7 days as a rollback window.
  5. Phase 4 – Post cutover validations and hardening (ongoing): schedule weekly audits for first 90 days, load test DSR flows monthly, and codify any operational gaps into change tickets.

Tradeoff to plan for: a parallel pilot protects consumer data but doubles integration work for a short period. Expect connectors to behave differently under real traffic; allocate engineering time to fix connector edge cases rather than assuming parity.

Concrete example: A regional retail chain migrated loyalty profiles by running a 6 week pilot for 10 percent of members. They verified consent enforcement for email and ad networks, executed three sample DSRs with full receipts, and measured a 60 percent reduction in manual DSR work. Because they required BYOK and deletion receipts in the contract, auditors accepted the migration evidence without additional requests.

Require replayable POC scripts and deletion_receipt evidence during procurement. If a vendor declines to run your script in their POC environment, they are not ready for production.

Quick RFP starter questions: Does the platform support BYOK and field level encryption? Can you demonstrate programmatic DSR export and erasure with deletion receipts? How are consent signals consumed and enforced in real time? Provide the current sub_processor register and most recent SOC or ISO report.

Frequently Asked Questions

Straight answers, no gloss. Below are the operational questions teams actually run into when implementing CDP data privacy, with concise, testable guidance you can use in procurement and POCs.

Short answers you can act on

Q: Can I profile customers in a CDP under GDPR? Yes — profiling is allowed when you have a valid lawful basis such as consent or a carefully documented legitimate interest assessment. What matters in practice is demonstrable linkage between the lawful basis, recorded consent versions (when used), and runtime enforcement that prevents profiling when the basis is absent.

Q: When does fitness or wellness data trigger HIPAA‑level controls? HIPAA applies when you are processing PHI on behalf of a covered entity or as a business associate. If class medical notes, clinician inputs, or insurer transactions are routed into the CDP, treat those fields as PHI until counsel and security confirm otherwise — and demand a BAA and hardened controls from the vendor.

Q: Is tokenization a substitute for consent? No. Tokenization lowers identifiability but does not remove processing obligations for marketing and profiling. Use tokenization to reduce exposure and combine it with explicit consent mapping and policy enforcement to cover legal and operational risk.

Q: What practical evidence should vendors provide during due diligence? Ask for sample deletion receipts, a recent SOC/ISO report covering the tenancy you will use, a subprocessors register with notification terms, and KMS snapshots showing key ownership and rotation. If they balk, treat the absence as a red flag.

Q: Fastest route to automate DSRs? Integrate a DSR orchestrator (for example platforms like Transcend or Securiti) with the CDP and require programmatic erasure/export APIs. The dominant failure mode is missing receipts — automation only counts when you can produce signed proof for each connector.

Concrete example: A regional healthcare operator wired a DSR orchestration service to their CDP. A portability request triggered identity verification via OTP, the orchestrator queried the CDP connector inventory, exported a unified JSON profile, and produced deletion receipts from the email provider and CRM within one business day. The team replaced a previously manual, multi‑week process and passed an external audit with the new machine‑readable evidence.

Operational tradeoff to accept: Real‑time enforcement offers the cleanest compliance posture but increases architecture complexity and test surface. Blocking at collection removes the compliance burden downstream but limits retrospective analytics. In practice, hybrid approaches work best: pre‑ingest filters for sensitive cohorts and post‑ingest policy enforcement where latency and replayability are acceptable.

Common misjudgment: Teams assume vendor marketing language equals audit readiness. Reality: features must translate into reproducible artifacts — signed JSON receipts, webhook traces, and connector logs — that you can hand to counsel or an auditor. Insist on scripted POC runs that produce those artifacts, not vague demos.

Must‑have for procurement: require a POC script that executes: ingest of a sensitive attribute, a consent revoke, a programmatic DELETE, and signed deletion receipts from at least two destinations. Keep the script and evidence in your vendor packet for audits. For technical baseline checks, compare vendor responses to your security folder such as Gleantap security and legal references like GDPR overview.

If a vendor cannot run your test script against their POC tenancy and produce machine‑readable evidence, move on — that limitation costs far more in audit time and remediation than the vendor discount you might win.

Next concrete steps (do these this week):

  • Run one scripted DSR in the POC: have the vendor return a signed deletion_receipt and connector webhook traces.
  • Verify key custody: obtain a KMS snapshot and confirm BYOK or equivalent controls with rotation logs.
  • Map consent to actions: export a consent ledger from your CMP and ensure the CDP persists a versioned consent object with timestamps.
  • Execute an ingestion block test: attempt to send a prohibited sensitive field and confirm the CDP strips or rejects it, with audit evidence.
  • Collect contractual proof: secure a sample DPA/BAA clause that includes deletion SLAs and subprocessor notification terms.