
 Divya Ghughatyal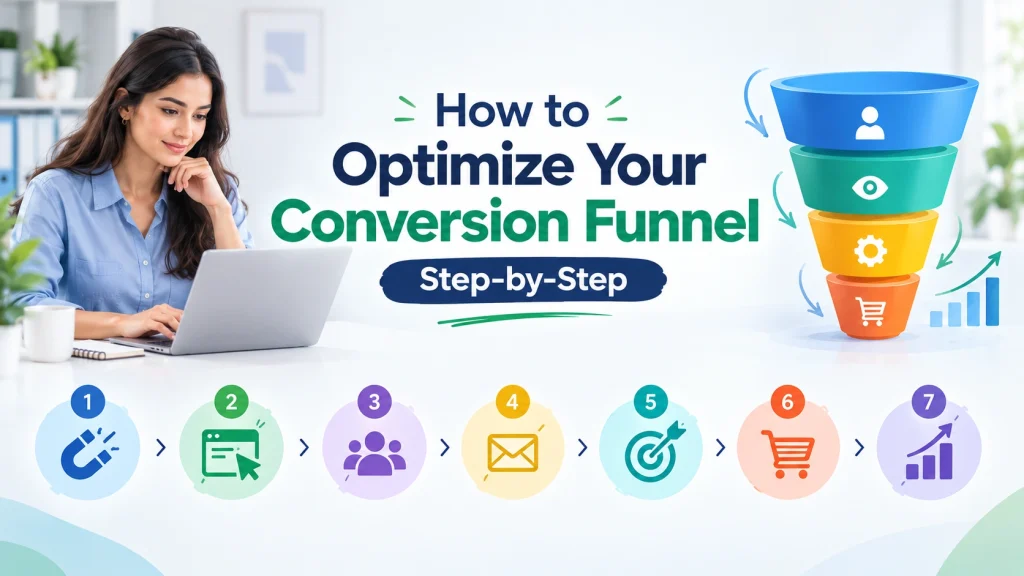
This step-by-step playbook walks growth teams through conversion funnel optimization to improve conversions and run disciplined conversion rate optimization experiments. You will get a funnel-mapping checklist, the right metrics to track, prioritization frameworks, A/B test templates, and a measurement checklist so you can find leaks, pick high-impact tests, and scale wins into email and SMS flows for ecommerce and membership businesses.
1. Define and map your conversion funnel stages and business goals
Start by mapping outcomes, not pages. Teams that treat the funnel as a list of URLs end up testing surface-level fixes that do not move revenue. Define stages based on what users are trying to do and what you can measure so every experiment ties back to a business goal.
Recommended funnel stages
Keep the stage names short and tied to actions. Use the same names in your analytics, experiment tags, and product backlog so reporting stays clear.
- Ecommerce: visits > product view > add to cart > begin checkout > payment completion (purchase)
- Membership / Fitness studio: visits > trial signup > onboarding complete > paid member > first class attended
If your site has limited traffic, combine nearby steps (for example, merge product view and add to cart into a single product intent stage) to keep sample sizes large enough for testing.
| Funnel Stage | Primary KPI (examples) |
| Product view | Click-through rate to add to cart, product page conversion rate |
| Begin checkout | Checkout start rate, drop-off rate between steps, average order value |
| Payment completion | Purchase conversion rate, revenue per session, first 30-day customer value |
| Trial signup | Trial-to-paid conversion rate, activation rate within 7 days |
Concrete example: A boutique fitness studio maps site visitors to class signups and memberships: visits > class page view > booking start > booking complete > membership conversion. The business goal is to increase monthly paid members by 15 percent. The immediate KPI is booking complete rate and the secondary KPI is 30-day membership activation. That mapping sets both what you test on-site and how you structure email and SMS triggers like trial welcome sequences and booking reminders.
1. Document stages: create a one-page funnel map with event names as they appear in your analytics tool.
2. Assign KPIs and owners: attach a primary metric, a dollar value where possible, and a single owner for each stage.
3. Set baseline windows: capture baselines over 30, 60, and 90 daysand note seasonal patterns.
Key takeaway: A usable funnel map names stages the way your analytics and testing systems will see them, ties each stage to a revenue-relevant KPI, and keeps the right balance between detail and testability.
2. Establish baselines with analytics and funnel reports
Baseline first, hypotheses second. Before you design tests, build a single source of truth for the funnel stages you care about and measure them consistently over defined time windows.
Track the same events everywhere. Use consistent event names across tools: page view, product view, add to cart, begin checkout, purchase, signup complete. Inconsistent naming is the biggest cause of unreliable funnel data.
Connect conversions to dollars. Conversion rate optimization without revenue per visitor is incomplete. Store average order value or subscription value on the purchase event so funnel reports show revenue impact, not just percentages.
Baseline metrics to record
- Per-stage counts and conversion rates. Sessions or users at each stage and the percentage that move forward.
- Absolute drop-offs. The number of users lost between stages, which gives better prioritization than relative percentages.
- Revenue per visitor and revenue per converting visitor. Use both for test sizing and expected impact.
- Segmented rates. New versus returning, mobile versus desktop, paid versus organic. Baselines by segment prevent misleading overall wins.
| Funnel Stage | Event | 30d Users | Conversion Rate | Drop-off % | Revenue per Visitor |
| Product view -> Add to cart | add_to_cart | 12,400 | 8.1% | 91.9% | $0.45 |
| Add to cart -> Begin checkout | begin_checkout | 1,005 | 65.0% | 35.0% | $2.10 |
| Begin checkout -> Purchase | purchase | 653 | 64.9% | 35.1% | $6.80 |
Concrete example: Imagine an ecommerce brand seeing its largest drop-off between product views and add-to-cart, with 91.9% of visitors leaving before adding an item. In this illustrative scenario, that gap could represent more potential revenue than a 2% improvement at checkout. The brand might then focus on product-page experiments and pair successful changes with cart-recovery SMS flows to capture additional revenue.
Key takeaway: A reliable baseline is not a one-time export. Maintain rolling 30 and 90 day funnel reports, validate events monthly, and tie every test to an expected dollar impact before you run it.
3. Run qualitative research to find where and why users drop off
Start with behavior first, explanations second. Run session recordings and heatmaps to see what users actually do, then use short surveys or interviews to understand intent. Your numbers tell you where the leak is. Qualitative tools tell you why.
Where to focus
Priority pages. Focus recordings and polls on funnel pages with the largest absolute drop-off: product detail, checkout start, payment page, and onboarding screens.
1. Start with recordings. Capture 500 to 2,000 sessions on high-drop pages to spot patterns like hesitation, repeated form edits, or users going back.
2. Add on-page polls. Trigger short polls after 15 to 20 seconds on checkout or when users move to exit.
3. Run exit surveys. Ask departing users one question about why they left.
4. Do lightweight interviews. Talk to 6 to 10 recent drop-off users for 10 to 15 minutes to confirm patterns from recordings.
Templates you can use today
- On-site poll (checkout page): What stopped you from completing your order today? (Options: Shipping costs, Payment issue, Need more time, Not ready to buy, Other)
- Exit survey (product page): What would make you more likely to buy this product? (Single-line response)
- 5-minute interview script: What were you trying to do on the site today? What stopped you? If you could change one thing, what would it be?
Concrete example: A clothing brand used session recordings on their payment page and found that 30 percent of users tried to re-enter card details after a vague error message. An exit poll confirmed users felt uncertain about payment security. The team replaced the generic error with specific instructions and a retry button, then A/B tested the change. The clearer message lifted checkout completion by 9 percent.
Key takeaway: Use recordings to spot patterns, polls to rank which patterns matter most, and short interviews to confirm root cause. Then turn each confirmed friction point into a testable hypothesis tied to a funnel metric.
4. Prioritize opportunities using PIE, expected impact, and effort estimates
Not every idea deserves an experiment. Prioritize by estimating potential, importance, and ease so the team runs fewer low-value tests and more experiments that can move revenue.
How to apply PIE
PIE scoring: Score each opportunity 1 to 5 on Potential (how much conversion could improve), Importance (how that metric ties to business KPIs), and Ease (effort and risk). Compute the PIE score as: (Potential + Importance + Ease) / 3. Rank high to low and pick the next 1 to 3 experiments.
| Opportunity | Funnel stage | Potential | Importance | Ease | PIE score | Est. monthly revenue impact |
| Reduce checkout steps | Checkout | 5 | 5 | 2 | 4.0 | $12,000 |
| Improve product images and mobile zoom | Product page | 3 | 4 | 3 | 3.3 | $4,800 |
| Add social proof on pricing and cart | Pricing / Cart | 4 | 4 | 4 | 4.0 | $7,200 |
Concrete example: An activewear ecommerce brand with 30,000 sessions per month, a baseline checkout conversion of 1.8 percent, and an average order value of $80 estimated that raising checkout conversion by 0.5 percentage points would produce roughly 150 additional orders per month — about $12,000 in new revenue. The formula: sessions multiplied by the conversion lift multiplied by average order value. Use that math to rank changes by dollar value rather than gut feeling.
Key takeaway: Use PIE or ICE (Impact times Confidence divided by Effort) to produce a ranked backlog, but treat scores as starting points. Confirm high-scoring items with small, fast tests before committing large engineering resources.
5. Build hypothesis-driven experiments and test designs
Start with a clear hypothesis. A test without a specific, measurable hypothesis wastes traffic. Write a statement that names the user group, the change, the metric you expect to move, and the reasoning.
Format: When [user segment] sees [change], then [metric] will move by [expected %] because [reasoning].
| Hypothesis field | Example |
| User segment | Returning visitors with an abandoned cart in the last 72 hours |
| Change | Show shipping cost earlier on the checkout page plus updated CTA copy |
| Metric | Begin checkout to purchase conversion; expect +6% lift |
| Reasoning | Late shipping surprises cause drop-off; earlier transparency reduces friction |
Concrete example: An ecommerce brand ran this hypothesis as an A/B test and paired it with a targeted SMS follow-up for the holdout group. The SMS amplified the winner, showing that site changes and owned channels should be tested together, not separately.
What to test first
- Product page: hero image swap, benefit line under price, urgency indicator. Measure product view to add to cart.
- Checkout: show shipping cost earlier, reduce required fields, inline form validation. Measure begin checkout to purchase.
- Onboarding and membership flows: shorten the first step, vary welcome messaging in email and SMS. Measure trial to paid conversion.
Design decisions
1. Pick one primary metric tied to revenue and list two secondary metrics as safety checks.
2. Record your plan in advance: hypothesis, sample size target, run duration, and segmentation plan.
3. Calculate sample size and run time using a calculator like Evan Miller. Cover at least one full weekly cycle.
4. QA across devices and confirm events fire correctly in analytics.
5. Segment results by new versus returning and by traffic source.
Do not peek at results early. Premature stopping is the largest source of false positives in A/B testing.
Key takeaway: Build tests that are small, measurable, and connected to revenue. If traffic limits you, move faster with targeted email or SMS experiments and measure combined channel lift.
6. Run tests, check validity, and read results correctly
Start with a decision rule, not hope. Before launching a variant, decide what you’ll measure, how much of a difference you’re looking for, how many people you need to test it with, how long the test should run, and when you’ll stop it.
Execution checklist
- QA visuals and tracking across browsers and mobile.
- Confirm the traffic split is even and users are not being double-counted.
- Set one primary metric and 2 to 3 secondary metrics to catch harms.
- Calculate sample size and fix a minimum run time to cover weekly cycles.
- Pre-specify which segments you will analyze.
- Make sure your A/B tool and analytics both tag the experiment ID.
Sample size and power matter more than p-values. If your run falls short of the required sample, a seemingly significant result is likely a fluke. Always inspect downstream revenue and customer behavior before full rollout.
Concrete example: An ecommerce team tests showing shipping cost earlier in checkout. They set checkout completion as the primary metric and target a 10 percent relative lift. After the planned run, they see a 12 percent lift but only among returning users. New users show no change and refunds stay flat. The team rolls the change to returning-user flows and designs a follow-up for first-time buyers rather than applying a risky sitewide change.
Key takeaway: Set your hypothesis, primary metric, sample size, and stopping rule before you start. Never call winners based on early looks. Validate through segments and downstream metrics before full rollout.
7. Scale winners, build them into retention flows, and keep iterating
Scale quickly, but with guardrails. A validated winner is not a permanent improvement until it survives rollout over time. Roll out winners sitewide when you see consistent lift across key segments, then monitor for novelty effects and downstream impact.
Rollout checklist
1. Feature-flag the change so you can revert fast if you see drops.
2. Stage the rollout: 10 percent to 50 percent to 100 percent over 7 to 14 days.
3. Track downstream KPIs: retention, average order value, refunds, and support tickets at 7, 30, and 90 days.
4. Watch segments for different effects across new versus returning and paid versus organic.
Bring winners into email and SMS
Translate winning elements into owned channels. A successful funnel change shouldn’t stop at the website. Carry the messaging, customer behavior, or triggers that drive improvement into your email and SMS journeys. Map trigger points: cart abandon leads to cart recovery SMS; checkout failure leads to emails plus SMS; new customer leads to a welcome series.
- Keep a 5 to 10 percent holdout to confirm the lift carries over.
- Measure the same way: track conversion events consistently and use UTM parameters.
Concrete example: A boutique fitness studio whose CTA test replaced “Join Now” with “Reserve Your Spot” rolled the winner into its welcome SMS and a 3-message cart recovery flow in Gleantap. The team kept a 10 percent holdout for 30 days and confirmed the lift carried to paid bookings before turning the variant on for all flows.
Ongoing cadence
- Monthly: capture hypotheses from analytics, recordings, and support tickets.
- Biweekly: pick 1 to 2 experiments using PIE and resource constraints.
- One live test at a time on low-traffic pages.
- Quarterly: convert repeated test wins into product or UX changes.
Key takeaway: Always preserve a holdout when moving on-site winners into email and SMS. That holdout confirms the lift across channels and protects you from false positives.
Frequently Asked Questions
This FAQ gives direct, usable answers for common conversion funnel optimization questions that come up during planning, testing, and scaling.
- How long should an A/B test run? Long enough to cover natural traffic cycles and hit your calculated sample size. For most mid-traffic sites that means two to four weeks. Low-traffic sites may need longer.
- What is the minimum traffic or sample size? There is no universal number. Plug your baseline conversion rate and the smallest lift worth pursuing into a sample-size calculator. If the required sample is too large, switch to smaller conversion goals or focus on email and SMS where you can iterate on repeatable signals.
- Which pages should I test first? Prioritize pages with the largest absolute drop-offs and where a change is easy to QA and measure. That usually points to checkout forms, pricing blocks, and cart pages.
- How do I combine qualitative and quantitative findings? Use analytics to point at the problem stage and qualitative tools to reveal the reason. Then build hypotheses that target the root cause. For example: high checkout abandonment plus recordings showing surprise shipping costs leads to testing earlier shipping disclosure.
- When should I personalize instead of testing sitewide? Personalize when segment behavior is clearly different, such as returning buyers converting 2 to 4 times higher than new visitors. If engineering resources are tight, start with targeted email and SMS before full site personalization.
- What quick wins improve conversions most often? Make price and shipping transparent early, cut unnecessary form fields, add meaningful trust signals on checkout, test CTA clarity rather than color, and use targeted follow-up for cart abandoners.
- How can I preserve or amplify site test wins in email and SMS? After a site win, update the corresponding messaging in your welcome, cart recovery, and reactivation flows so the lift reaches owned channels. Gleantap’s email and SMS flows make this straightforward to set up and measure.
Key takeaway: Measure in dollars, not only percentage points. Pick a realistic minimum detectable effect tied to revenue, calculate sample sizes, and if traffic is too low, shift effort to owned channels to get reliable wins faster.
Concrete example: A boutique fitness studio found a 30 percent drop between trial signup and first attended class. Recordings and short user interviews revealed confusion about class credits and cancellation policy. The team tested a simplified onboarding email sequence that clarified booking steps and added an SMS reminder 24 hours before the first class. Attendance rose 18 percent, producing a measurable lift in paid conversions when rolled into the standard welcome flow.
Next actions you can start this week: 1) Use a sample-size calculator to set the required sample for your highest-impact funnel step. 2) If that sample size is too large, build an email or SMS test that mirrors your site hypothesis and measure lift in owned channels. 3) Pick three guardrail metrics (revenue per visitor, refund rate, and checkout completion) and require a pass on all three before calling a winner.



Ready to Run Successful Marketing Campaigns and Grow Your Business?
Gleantap helps you unify customer data, track behavior patterns, and automate personalized campaigns, so you can increase repeat purchases and grow your business.
Ready to Run Successful Marketing Campaigns and Grow Your Business?
Gleantap helps you unify customer data, track behavior patterns, and automate personalized campaigns, so you can increase repeat purchases and grow your business.