Blog
Insight and updates
Gleantap helps you capture every stage of your customer journey, identify and target customers, and automate follow-ups across text, email, and social media that lead to revenue growth.
The 8 Best Fitness CRM Software Platforms in 2026 (Honest Comparison)
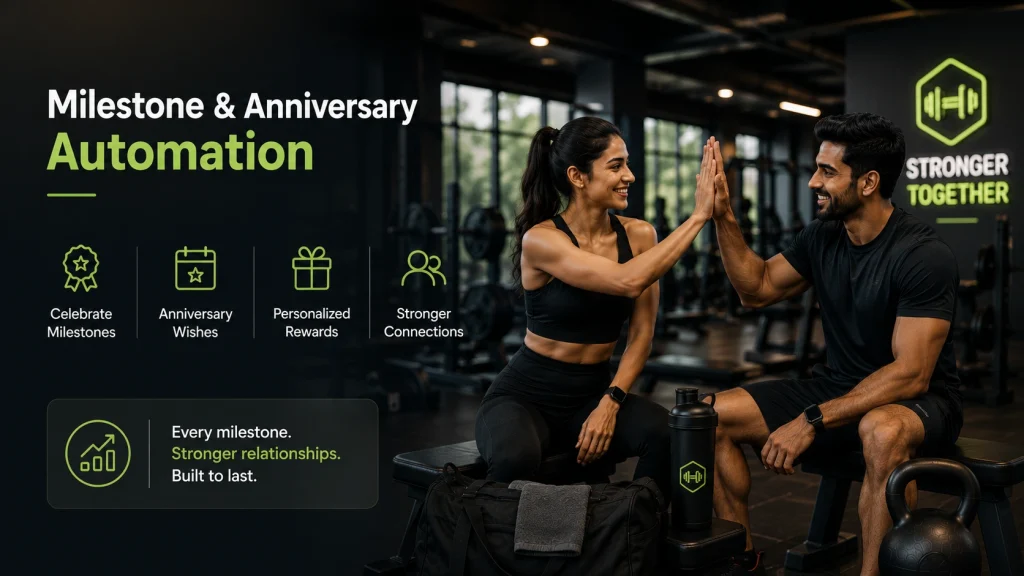
Milestone and Anniversary Automation to Strengthen Customer Relationships
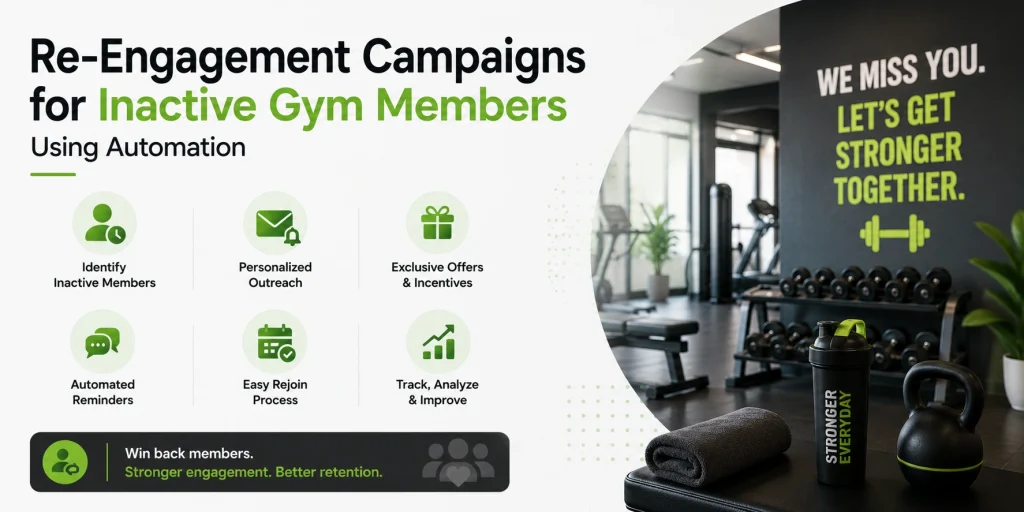
Re-Engagement Campaigns for Inactive Gym Members Using Automation
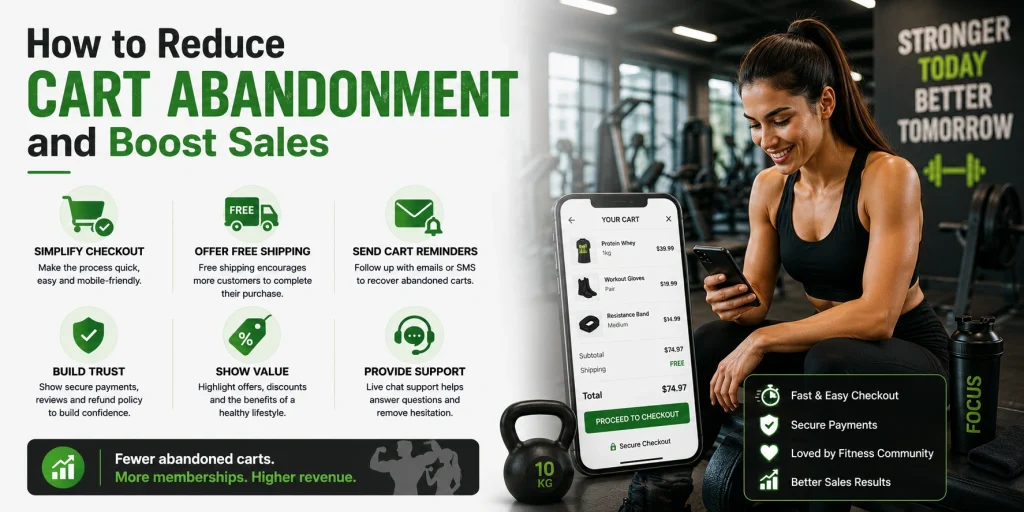
How to Reduce Cart Abandonment and Boost Sales
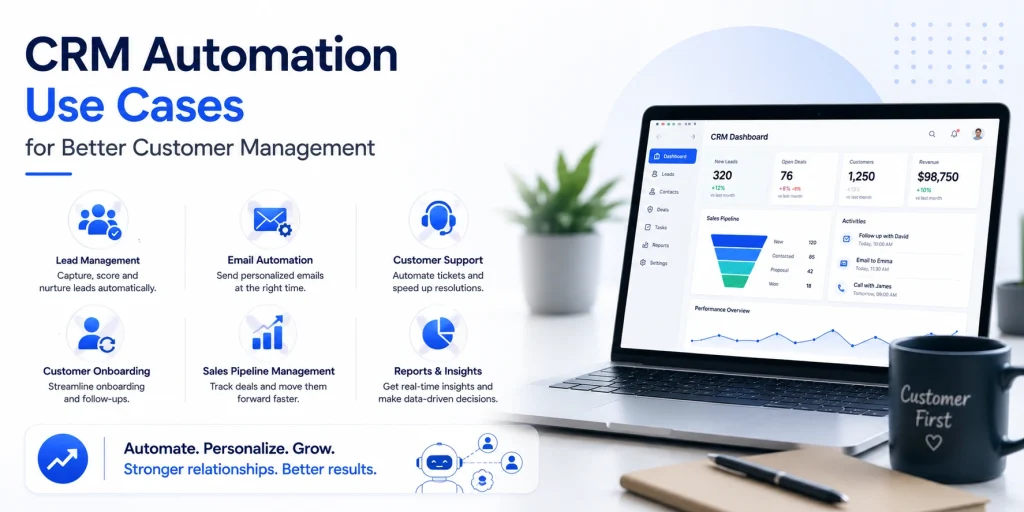
CRM Automation Use Cases for Better Customer Management
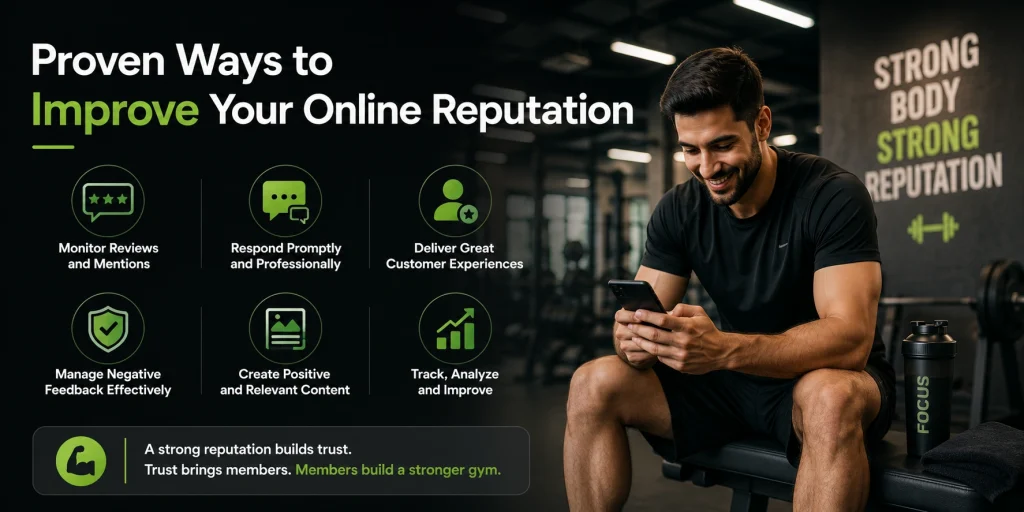
Proven Ways to Improve Your Online Reputation
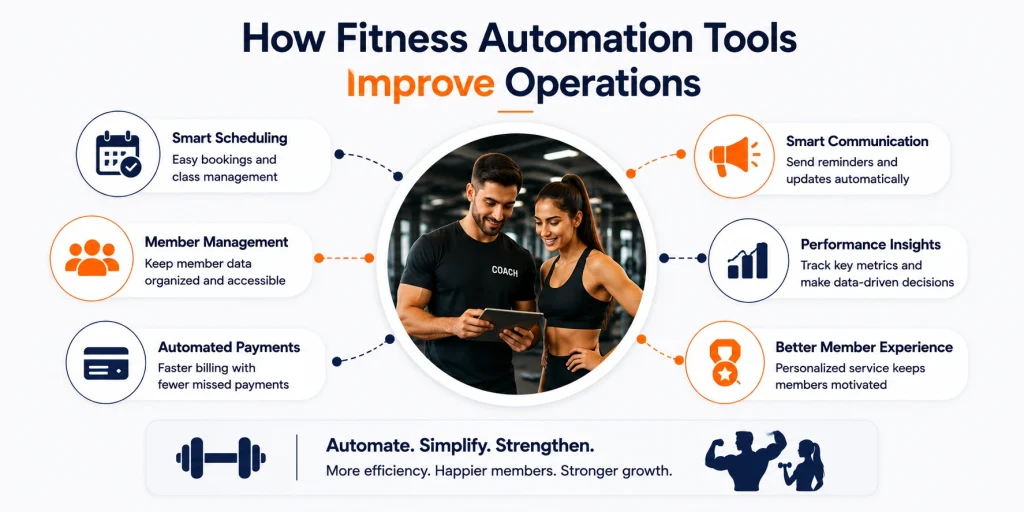
How Franchise Automation Tools Improve Operations
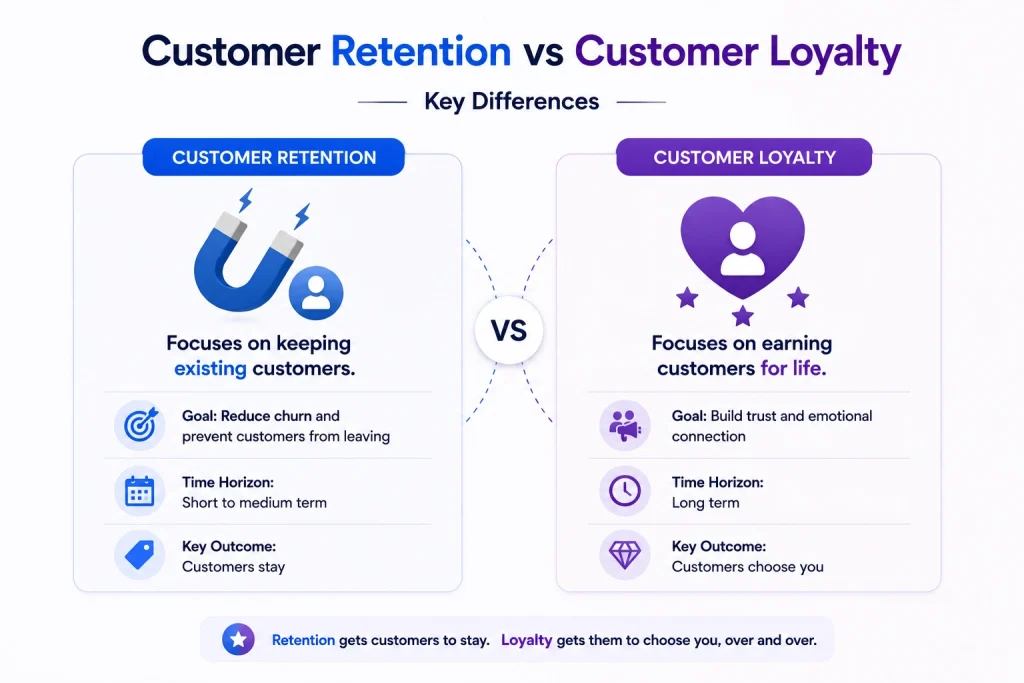
Customer Retention vs Customer Loyalty: Key Differences

Landing Page Optimization Techniques That Convert
Ready to Run Successful Marketing Campaigns and Grow Your Business?
Gleantap helps you unify customer data, track behavior patterns, and automate personalized campaigns, so you can increase repeat purchases and grow your business.
Ready to Run Successful Marketing Campaigns and Grow Your Business?
Gleantap helps you unify customer data, track behavior patterns, and automate personalized campaigns, so you can increase repeat purchases and grow your business.