
 Divya Ghughatyal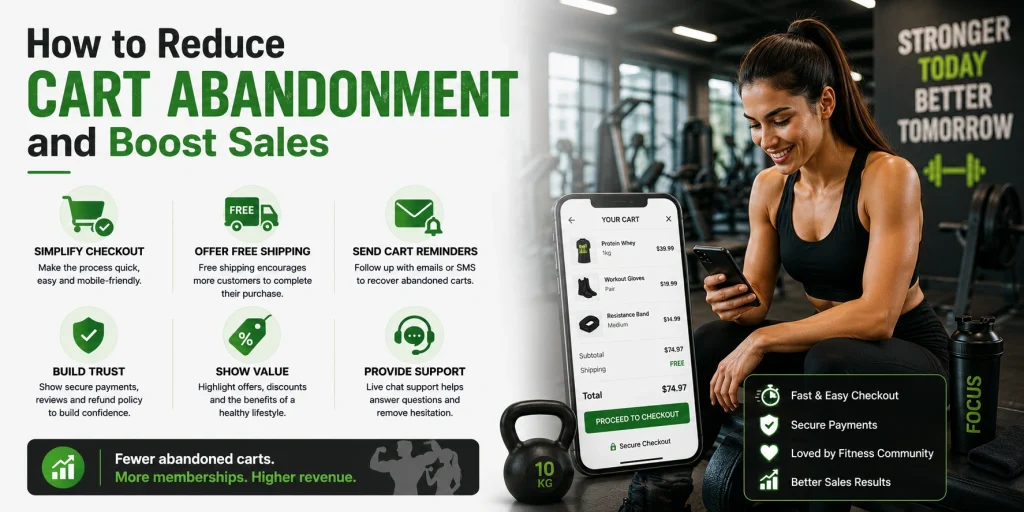
If your checkout funnels are leaking revenue, this practical guide shows how to reduce cart abandonment and convert more of the traffic you already pay for. You will get a prioritized diagnostic to find the worst choke points, a short checklist of high impact checkout fixes, and multi channel cart recovery strategies including email and SMS cadences. Follow the 30 day playbook to run quick experiments, measure incremental revenue, and decide which changes to scale first.
There is a limit to what the cart page can fix. A delivery estimate only reduces abandonment if the warehouse behind it can hit the date, and a free shipping threshold only helps if the cost of meeting it does not eat the margin on the order. That is where the fulfillment setup enters the decision, and 3PLs like Rush Order are one way brands handle it, holding stock in fulfillment centers across North America, Europe, Asia and Australia so an order ships from the location closest to the buyer. The choice is between keeping everything in one warehouse and accepting longer transit times on distant orders, or splitting inventory across locations, which shortens the delivery window but adds forecasting work per site. Settle what your delivery promise can realistically be before you test how to display it, because a date you miss costs more than a date you never showed.
Audit shopping funnel and segment abandonment by device, channel, and step
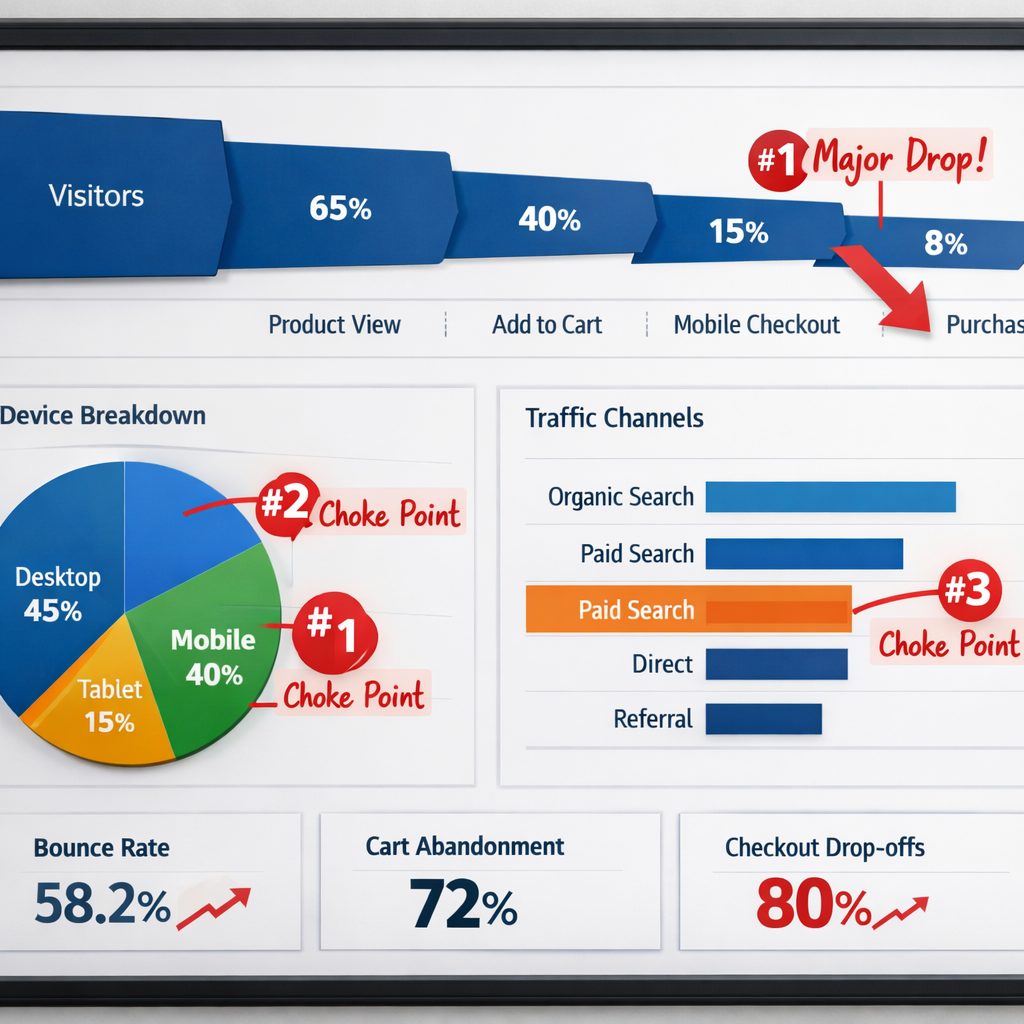
Start here: map where people drop off, not why you think they drop off. A segmented funnel — by device, marketing channel, checkout step, and user type — tells you which fixes will move revenue. Without that map you will waste time on low-impact experiments or on messaging when the real problem is payment friction or surprise shipping costs.
Key metric first: calculate cart abandonment rate as (number of carts created minus purchases) divided by number of carts created.** Also capture checkout abandonment by step (cart to checkout, checkout step 1 to 2, payment submission to order), conversion rate by device, and a recovery baseline for later AB tests so you can measure incremental gains.
Run these reports immediately
- Funnel by device and browser: cart to order conversion for mobile iOS, mobile Android, desktop Chrome, desktop Safari
- Channel segmented: organic, paid social, email, affiliates, paid search with landing page and creative that drove the session
- Checkout step breakdown: percentage drop at each step and absolute count of lost sessions per step
- Behavioral overlays: session recordings and rage click clusters from FullStory or Hotjar for the worst performing device/channel segments
- High-value segments: carts above an AOV threshold, carts with coupons applied, returning customers, and carts with restricted shipping zones
- Customer join: stitch behavioral signals to transactions using a profile store
Practical insight: prioritize fixes by absolute revenue impact, not only by percent change.** A 10 percent drop in a low volume segment does not beat a 3 percent drop where traffic is 10 times larger. Build a short list of the top three choke points ranked by estimated weekly lost revenue.
Concrete example: Mobile Chrome users arriving from a Facebook campaign might show a 45 percent cart to checkout drop while desktop converts at 20 percent.** If that mobile segment represents 60 percent of sessions, fixing one mobile-specific issue such as an incompatible payment widget or slow address lookup will recover more orders than a sitewide copy tweak. Document the segment, the step with highest exit, and a one line recommended fix for each of your top three segments.
Trade off and limitation: analytics are messy across devices and attribution windows.** Cross device sessions, logged out users, and bots will distort counts. You must combine session analytics with order data to avoid chasing false positives. Use holdout groups and reconcile recovered orders to purchase events rather than relying on clickthrough metrics alone.
| Segment | Signal to watch | Immediate action |
| Mobile Safari from paid social | High cart abandonment, slow form completion time | Enable Apple Pay, reduce fields, record FullStory drops |
| Desktop organic with coupon used | High checkout abandon at payment | Promote PayPal and alternative payment options, test payment placement |
| Returning customers with high AOV | Abandon after shipping cost shown | Test free shipping threshold or targeted free shipping code |
Context: overall cart abandonment averages about 69 to 70 percent according to Baymard Institute. Prioritize the segments that explain the largest share of that loss rather than chasing the average. See Baymard Institute checkout usability for reference.
Deliverable: a prioritized top three choke points list with screenshots or segments, one recommended fix per choke point, and an estimated weekly revenue recovery.**
Next: build the segments, capture a two week baseline, and set simple holdouts so every recovery test measures true incremental revenue.
Remove checkout friction and increase buyer confidence
Direct fix first: reduce the number of decisions and the perceived risk in the final moments before payment. Most shoppers abandon because checkout feels slow, confusing, or unsafe — which is fixable with targeted, low-effort changes that marketing can own while engineering schedules bigger work.
Priority, engineering-light fixes
- Guest checkout and progressive capture: let customers buy now and ask for account details after purchase or during a smaller, optional step
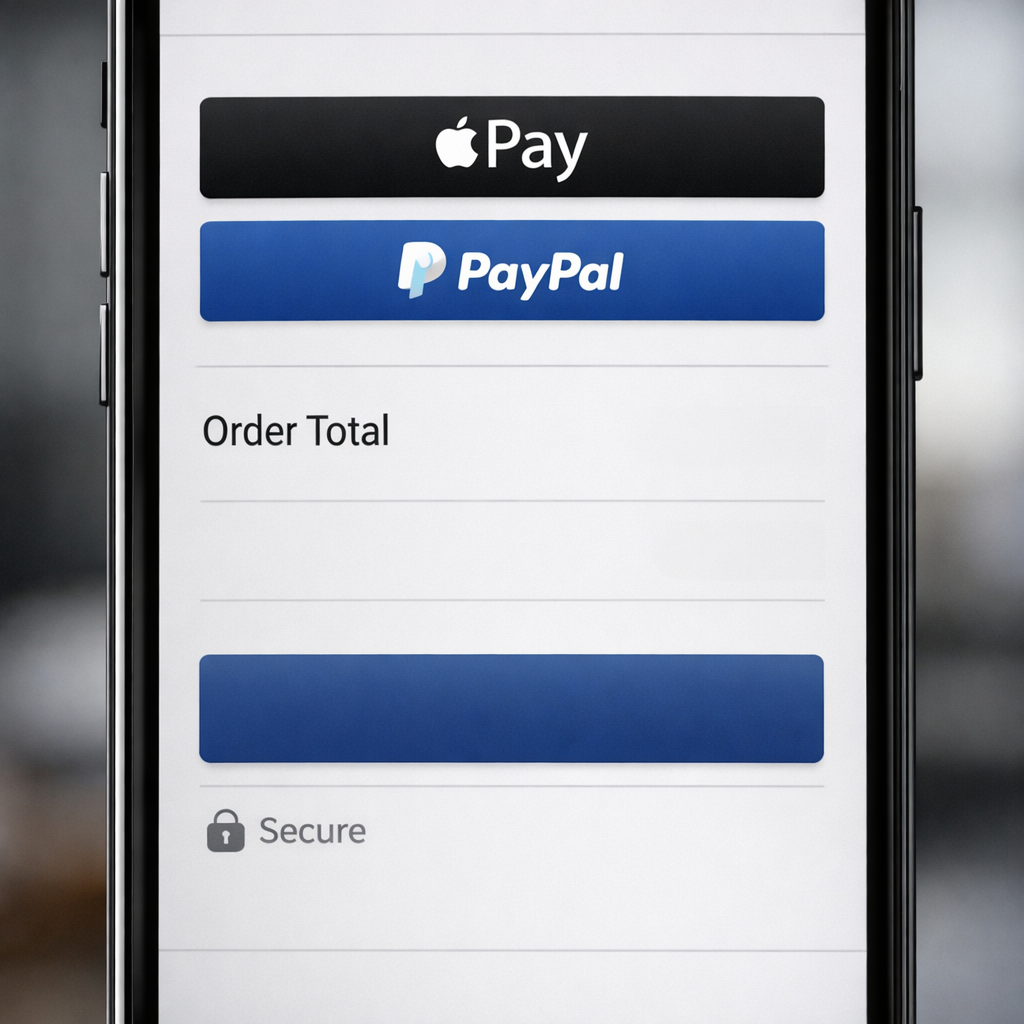
- Prominent one-click payments: display Apple Pay / Google Pay / PayPal as top checkout buttons on mobile and desktop; these remove form friction and speed completion
- Reduce fields and enable autofill: remove nonessential inputs, use address lookup, and mark progressive fields to shave seconds off completion time
- Show total cost early: calculate shipping and taxes on the cart page or show a clear estimator to eliminate surprise costs
- Progress indicator and single-column layout: clarify steps and keep the CTA visible; inconsistent layouts lose trust and increase error rates
- Security and fulfillment cues: place a small set of trust signals near the CTA — secure badge, seller name, and expected delivery date
Trade-off to consider: adding third-party payment widgets often improves conversions but can slow page load and complicate tracking. If a payment script increases First Contentful Paint by more than 300 ms on mobile, you may erase the gains from faster checkout. Measure performance impact and lazy-load noncritical scripts where possible.
Three practical A/B tests you can run this week
- Field removal test: remove one optional field (company, second address line) on the checkout page vs control and measure completion rate and data quality
- Payment prominence test: show Apple Pay / Google Pay above the standard card form vs below and measure conversion lift on mobile
- Price transparency test: show full estimated total (tax + shipping) on cart page vs show at checkout and compare cart-to-checkout and checkout-to-order rates
| Fix | Estimated effort | Expected impact |
| Enable guest checkout | Low (config + copy) | High – immediate drop in abandonment for first-time buyers |
| Add Apple Pay / Google Pay | Low-Medium (vendor integration) | Medium-High – big win on mobile traffic |
| Add shipping estimator on cart | Medium (rate calc + UI) | High – removes surprise costs that drive abandonment |
| Consolidate checkout fields | Low (UX change) | Medium – reduces errors and speed to completion |
Implementation note: prioritize changes that remove surprise costs and shorten time-to-pay. Start with guest checkout and one-click payments, then add shipping transparency — that sequence usually delivers the fastest measurable uplift.
Concrete example: a mid-size apparel retailer added Apple Pay and a compact single-column checkout and saw faster mobile completion in Production metrics within two weeks. They lost some marketing-captured email addresses at purchase, so they immediately ran a post-purchase account-creation prompt and an onboarding email to recover those profiles — a small operational trade-off that preserved conversion gains.
What people get wrong: plastering trust badges everywhere without addressing functional friction is cosmetic. Trust signals matter only when the process itself is quick and predictable. Focus on removing real blockers — unexpected costs, payment friction, and long forms — then layer credibility cues.
Next step: implement guest checkout and add a one-click payment option this week, then A/B test shipping cost visibility on the cart page. Track cart-to-order and mobile completion separately.
Make pricing, shipping, and returns transparent before checkout
Key point: surprise shipping, hidden taxes, and vague returns are one of the top immediate reasons shoppers abandon carts – show the numbers and policies before they click checkout so buyers can evaluate cost without uncertainty.
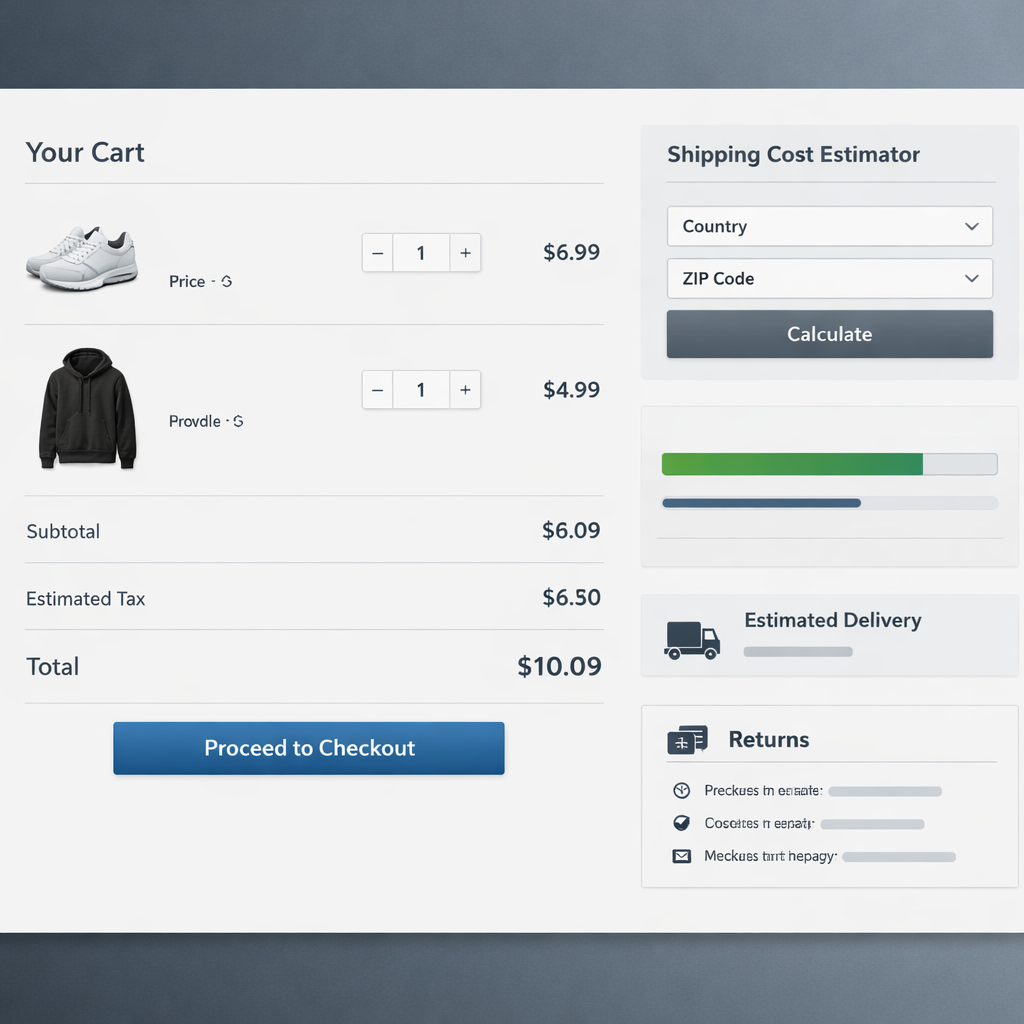
What to surface on the cart page (and why)
- Shipping cost estimator: display a reliable estimate based on zip code or country, and label it as estimated when appropriate
- Taxes shown early: calculate sales tax where possible or show a clear statement when taxes will be added at checkout
- Expected delivery date: show a delivery range with origin and shipping speed – buyers react to dates, not vague timelines
- Returns snapshot: a short 2-3 bullet returns summary with a link to the full policy – include who pays return shipping and the return window
- Free shipping progress meter: show how much remains to qualify for free shipping to both nudge and increase average order value
- Payment-cost callouts: if certain payment methods add fees or offer discounts – show those differences up front
Practical insight: implementing accurate shipping estimates has diminishing returns if you grind through every carrier rate for every SKU. Start with a rules-based estimator – fastest and cheap to build – then layer in carrier APIs for top SKUs or high-value baskets.
Trade-off to consider: exposing exact shipping and returns can lower friction and increase conversions – but it also increases returns for some categories. If your margins are tight, prefer free-shipping thresholds or local pickup options over blanket free returns.
Technical note: if engineering bandwidth is limited, add simple server-side or client-side logic that returns an estimated cost band – for example Low, Medium, High – rather than a single precise rate. That removes the surprise without a full integration.
Concrete example: Chewy uses upfront delivery windows and a clear returns promise on product and cart pages – customers know when a replacement or refund will occur. Wayfair often shows both standard and expedited delivery costs on the cart, plus an estimated arrival date, which reduces last-minute quitters for bulky items.
Metric to track: monitor cart to checkout rate and cart-to-order conversion before and after changes, and measure AOV and return rate for 30 and 90 days to capture downstream effects of more transparent policies.
What to test first: A/B test a simple shipping-cost indicator on the cart page – one variant with a calculated estimate or free-shipping meter and one without. Use a holdout to measure true lift and watch for changes in return rate or customer support contacts.
Showing costs early reduces abandonment by removing uncertainty – but it must be paired with margin-appropriate levers such as thresholds, local pickup, or selective free returns to avoid eroding profitability.
Next consideration: after you make pricing and returns visible, observe where people still drop – if abandonment stays high for international buyers or high-weight SKUs, prioritize localized shipping options or pickup alternatives next. For more on checkout usability research, see Baymard Institute.
Design multi-channel cart recovery journeys with timing and templates
Clear principle: a recovery journey is a timed conversation, not a single message. Each send must have a distinct purpose, a target segment, and a measurable goal or it will waste budget and annoy customers.
Three-track timing framework
Immediate track (0 to 6 hours): capture impulse and obvious interruptions. Send a light reminder with product image, price, and a single CTA back to the cart. Use email first, then SMS for opted-in users who added high-intent items.
Mid track (6 to 48 hours): reinforce value and address objections. Use richer content: social proof, one-sentence benefits, shipping info, and optional urgency for limited stock. Add web push or exit-intent popup for anonymous visitors who return to site.
Last-chance track (48 to 96 hours): targeted incentives only. Offer non-price alternatives first such as split payments or free shipping. Reserve discounts for carts above a value threshold or high LTV segments.
Practical cadence and templates
- Sample cadence for consenting customers: Email at 1 hour, SMS at 6 hours for carts > threshold, Email at 24 hours with urgency or shipping info, Final email at 72 hours with incentive for high-value carts.
- Email template elements: dynamic product image, price, expected delivery date, 1 line social proof, clear primary CTA. Keep preview text actionable and specific.
- SMS template elements: 1 short line, cart value mention, direct link to cart, opt-out instruction. Keep links shortened and track clicks.
- Web push or exit-intent: single-line reminder with item thumbnail and CTA; use sparingly to avoid banner fatigue.
Template example: Email subject Use Your Cart is Waiting – include dynamic cart item name in subject line. Email body show single product image, price, expected delivery, and button Return to Cart. SMS Use the cart reminder cadence only for opted-in users and include opt-out language.
Tradeoff to acknowledge: SMS converts faster but has higher incremental cost and legal risk. Over-message and you will increase opt-outs and complaint rates. Treat SMS as a high-value, restricted channel and apply stricter frequency caps and value thresholds.
Segmentation that matters: split flows by cart value, new versus returning customer, referral source, and device. Mobile abandons respond faster to SMS and push. High-value carts deserve earlier SMS and tailored incentives; low-value carts get a lighter email-first approach.
Measurement and holdout design: always include a holdout control. Start with 10 to 20 percent holdout for each flow. Use a 7 day attribution window for routine items and 30 days for big ticket. Attribute incremental revenue as recovered orders in treatment minus recovered orders in holdout.
Compliance checklist: capture explicit opt-in for SMS, include opt-out language in every message, and follow TCPA and GDPR guidance. See Twilio SMS best practices for a quick reference.
Concrete example: A mid-market cosmetics retailer segmented carts into under 50 and over 50. For carts over 50 they sent email at 1 hour with product image and reviews, SMS at 6 hours for opted-in shoppers, and a 72 hour email offering free expedited shipping only for returning customers. The team measured recovered orders against a 15 percent holdout to isolate incremental impact and then scaled the winning sequence to similar SKUs.
Common misjudgment: teams often default to blanket discounts. In practice the biggest wins come from timing, relevant messaging, and selective channel use. Discounts move conversion but erode margin and train customers to wait. Use incentives strategically and test them with holdouts.
Key takeaway: build at least two recovery templates per channel – reminder and last-chance – and gate SMS for high-value carts and opted-in users. Use a 10 to 20 percent holdout to measure true incremental revenue.

Next consideration pick the channel mix you can support consistently, build the templates for each segment, and instrument a holdout so you know whether the sequence actually helps reduce cart abandonment or merely shifts timing.
Personalize recovery using behavioral triggers and product intelligence
Concrete point: Personalized recovery based on recent behavior and product intelligence outperforms one-size-fits-all abandoned cart messages because it addresses the specific reason a shopper left and the exact item context they cared about.
Practical insight: Start small. Ship two high-value triggers first – a cart abandonment after payment failure and repeated product page views without add to cart. Personalization is powerful, but its ROI collapses if your data is stale or you try to automate every edge case at once.
What to trigger on and why it matters
- Behavioral triggers: abandoned cart after coupon attempt, failed payment, cart edit then exit, multiple returns in past 90 days – these show intent and obstacle type.
- Product intelligence: low stock on the exact SKU, size or color popularity, complementary item pairs, and profit margin band for the SKU – use these to decide urgency, cross-sell, or discount.
- Customer signals: lifetime value, purchase frequency, preferred channel, and previous response to offers – tailor the severity of incentives and channel choice.
Tradeoff to consider: Product-level personalization requires reliable SKU-level events and real-time inventory. If your feeds lag, you risk sending incorrect availability or price messages which damages trust more than a bland generic reminder.
Trigger matrix – examples you can implement first
| Trigger | Signal used | Personalization action |
| Payment failure at checkout | Payment error code, cart value, payment method | Send SMS to opted-in high-LTV customers offering quick phone help or alternate payment link; show payment method specific fix tips |
| Repeated views of same product | 3+ page views in 48 hours without add to cart | Email with dynamic image of viewed SKU, social proof for that size/color, and low-stock alert if applicable |
| Coupon entered then abandoned | Attempted coupon type and cart margin | Targeted email offering free shipping instead of discount for margin sensitive carts; test small discount only on high-value baskets |
Concrete example: A mid-market athletic apparel retailer used product intelligence to detect repeated viewership of a shoe in a specific color. For returning customers with LTV above the 75th percentile they sent an SMS showing the exact shoe image, available sizes, and a one-click buy link; recovered orders from that cohort were three times the baseline recovery rate for generic emails.
- Low-value cart template: Quick reminder with product thumbnail and one-line reason to complete – free shipping threshold or simple returns info.
- Medium-value cart template: Add social proof and complementary product suggestion. Offer split payment option or express checkout link rather than a discount.
- High-value cart template: Use stronger incentives only when margin allows. Include personalized concierge message, inventory scarcity, and preferred-channel CTA; for high-LTV users prefer SMS or direct call option.
Judgment that matters: Marketers overuse discounts. In practice non-price personalization – size availability, return reassurance, alternate payment options, and urgency tied to inventory – recovers more profitable orders than blanket coupons.
Key takeaway: Build a prioritized personalization ladder: 1) identify top intent signals, 2) map per-signal message and channel, 3) test with holdouts. Measure incremental recovered revenue by cohort before scaling.
Next consideration: After the first two triggers are live, integrate customer profiles.
Run experiments and measure uplift instead of vanity metrics
Key point: Stop optimizing for opens, clicks, or session time and design experiments that measure incremental recovered revenue and orders attributable to your recovery work.
What to test and why incremental measurement matters
What to prioritise: Test changes that affect behavior at scale — checkout field removal, payment option prominence, timing of the first recovery message, or adding SMS for opted-in users. These touch points change completed orders; email open-rate gains do not. Use funnel data from your audit to pick the choke point with the largest drop-off and test there first.
Measurement rule: Use a randomized control or holdout group and an attribution window informed by product buying cycles. Incremental recovered revenue = revenue from recovered orders in treatment minus revenue from recovered orders in control during the same window. If you skip a holdout you will overestimate impact.
| Vanity metric | Why it deceives | Metric to use instead |
| Email open rate | Measures curiosity not purchase | Recovered orders attributed to treatment |
| Click-through rate on recovery email | Clicks can be organic or accidental | Incremental conversion lift vs control |
| Sessions after an on-site popup | May cannibalize other channels | Net incremental orders and revenue in test cohort |
Practical experiment design guidance
- Holdouts matter: Keep a 10 to 25 percent holdout for recovery campaigns. Smaller sites can start at 10 percent to limit revenue risk while retaining power for detection.
- Attribution window: Use 7 days for fast-consideration goods, 30 days for higher-consideration purchases. Match the window to customer behavior or you will under- or over-count recovered orders.
- Primary KPI: Use incremental recovered orders and incremental revenue. Track AOV, repeat-rate, and margin impact as secondary KPIs.
- Power vs speed trade-off: If traffic is low, run directional tests and validate with repeated experiments rather than waiting months for classical significance.
Limitation and trade-off: Running large holdouts reduces short-term recovered revenue. That is intentional insurance — you sacrifice some immediate recovery to know whether a campaign truly works. If your business cannot tolerate that, you must accept weaker causal evidence and greater risk of rolling out ineffective (or harmful) changes.
Concrete Example: A mid-market fitness apparel retailer A/B tested making Apple Pay and PayPal buttons visually dominant on mobile checkout and put 15 percent of visitors into a holdout. The treatment produced a 1.8 percentage point lift in conversion on mobile and, after attribution, a 12 percent increase in recovered revenue from abandoned carts. Without the holdout they initially attributed seasonal improvement to the change and nearly doubled their expected ROI.
Judgment: Prioritize experiments that remove friction or change payment flow over small copy tweaks. In practice, UX and payment experiments move revenue; optimistic email or design changes often only boost vanity metrics.
Quick formula: Incremental revenue = (Revenuetreatment from recovered orders) – (Revenuecontrol from recovered orders). Use the same attribution window and customer segments for both groups.
Next consideration: After you validate uplift with a holdout, roll winners into staged rollouts while continuing to monitor key metrics for downstream effects on returns, chargebacks, and LTV.
A 30-day prioritized action plan to reduce cart abandonment
Concrete assertion: A tightly scoped 30-day plan that sequences diagnostics, high-impact quick wins, and one controlled experiment will reduce cart abandonment faster than scattered tactical changes. Prioritize fixes you can measure within the month and defer large platform rewrites to the next quarter.
Week 1 – Rapid diagnosis and immediate wins
- Run a 48 hour funnel snapshot: Pull cart to purchase conversion by device and channel and flag the top three leak points. Use GA4 or Shopify analytics and session replay for confirmation. See Baymard Institute for common usability sinks.
- Implement quick UI fixes: Enable guest checkout if missing, surface clearer shipping costs on cart, and add at least one familiar digital wallet like Apple Pay or PayPal. These take low engineering time with high expected impact.
- Set baselines and owner: Record current cart abandonment rate, recovered revenue baseline, AOV, and assign a single owner responsible for the 30 day deliverables.
Week 2 – Messaging, opt ins, and minimal personalization
- Launch a minimal recovery sequence: Deploy a 3-message email flow with images and dynamic cart items; include a holdout group that is at least 10 percent of eligible visitors to measure incremental effect.
- Capture opt ins cleanly: Add an email and SMS consent checkbox at checkout with clear language. Do not send SMS until consent is verifiable. Reference Twilio guidance for SMS best practices at Twilio SMS.
- Personalize by value: For carts above a chosen threshold add a subtle incentive option such as free shipping or split payment. Use customer profile signals where available to pick channel and message tone.
Week 3 – Run one controlled experiment and tighten attribution
- Pick one hypothesis: Example: removing one required form field increases checkout completions. Run A/B test with equal traffic splits and precomputed sample size to reach statistical power in 7 to 10 days.
- Instrument attribution: Tag recovery messages and ensure recovered orders can be attributed to the campaign window you define. Track incremental orders, recovery rate lift, and change in AOV.
- Monitor compliance and deliverability: Watch email open rates, SMS opt outs, and cart recovery attribution weekly. Pause or adjust cadence if complaint rates rise.
Week 4 – Analyze, roll forward winners, and plan scale
- Evaluate winners on incremental lift: Compare treatment versus holdout on recovered orders and revenue. If the lift justifies cost, roll changes to 100 percent traffic.
- Prioritize next quarter engineering work: If shipping transparency or payment methods moved KPIs, budget full implementation and QA next quarter.
- Document runbook and SOPs: Save templates, consent copy, and the experiment setup so repeating or scaling the flow is operationally simple.
Practical tradeoff: Running holdout groups reduces short term recovered revenue because you intentionally withhold a treatment from some users. That tradeoff is necessary. Without it you will not know which tactics are incremental rather than cannibalizing conversions you would have captured anyway.
Limitation to watch: Small sites will hit sample size limits. If your traffic cannot reach statistical power in 7 to 10 days, extend test duration or choose higher impact changes so signal emerges faster. Avoid chopping tests into too many variants.
Concrete example: A mid market sporting goods retailer used this sequence. In week 1 they enabled guest checkout and PayPal. Week 2 they launched a 3 step email flow with a 10 percent holdout. Week 3 A/B testing removed an unnecessary address field. By day 30 they measured a 3.8 percentage point increase in conversion from cart to purchase and a clear signal that removing the field was the main driver.
Key metrics to track this month: cart abandonment rate, recovery rate for treated vs holdout, incremental recovered orders, incremental revenue, average order value, and SMS opt out rate.
Next consideration: After 30 days you will know which small fixes and messaging changes are incremental. Use those results to justify engineering projects that require larger effort and to set a tested cadence for ongoing cart recovery campaigns.
Frequently Asked Questions
Quick orientation: These answers focus on what to decide this quarter, not theory. Expect tradeoffs between speed and margin, and between reach and compliance when you scale recovery channels.
What is a realistic first month improvement target for reduce cart abandonment?
Realistic target: Aim for a 2 to 6 percentage point drop in abandonment or a single-digit lift in recovered orders in month one after a focused diagnostic and a basic recovery flow. Your actual result will hinge on baseline metrics, traffic quality, and whether you fix obvious checkout friction first.
Context: Average global cart abandonment is ~69 to 70 percent according to the Baymard Institute. Small absolute improvements are high-impact for revenue.
Should I use SMS or email first for cart recovery?
Channel order: Start with email because consent coverage is broader and cost per send is lower. Add SMS only for explicitly opted-in customers and for time-sensitive nudges. SMS buys speed but raises unsubscribe risk and compliance overhead.
Practical nuance: Use email for rich content and multiple reminders, and reserve SMS for a single early nudge or urgent high-value carts. A common pattern that works in practice is email at 1 hour, SMS at 4 hours for opted-in users, then an email at 24 hours with social proof or urgency.
How much should I discount to recover an abandoned cart?
Discounts are a tool, not a strategy. Test non-price levers first: free shipping, flexible payments, clearer delivery dates, or showing low-stock messages. If you must discount, target offers by cart value or customer LTV so you avoid training browsers to expect price cuts.
Tradeoff to watch: Discounts increase short-term conversion but reduce margin and can lower future price tolerance. For predictable ROI, model the incremental lifetime value before approving blanket discounts.
How do I measure incremental revenue from cart recovery campaigns?
Use holdout groups and an attribution window. Randomly withhold the recovery flow from a control cohort and compare recovered orders and revenue to the treatment cohort over a pragmatic window such as 7 to 30 days depending on product buying cycle.
Implementation note: Attribute only orders that match the abandoned cart contents and customer identifiers to avoid double counting. If you use GA4 or Klaviyo, align event names and UTM tagging and check for cross-device gaps. See Klaviyo abandoned cart guide for practical templates.
What legal checks are required before sending SMS recovery messages?
Minimum requirements: Keep explicit opt-in records, include clear opt-out instructions in every message, and retain proof of consent for at least the period regulators in your markets require. Consult legal, but operationally use providers that log consent and message history.
Resource: For implementation best practices and compliance tools, refer to Twilio guidance on SMS best practices at Twilio SMS best practices.
When should I stop sending recovery messages to the same user?
Practical rule: Limit the automated recovery sequence to 2 to 4 touches over 72 hours for a single cart. If a customer ignores these, move them into a lower-intensity engagement stream rather than repeating the same sequence. Repeated, aggressive contacts harm long-term retention more than they recover a few orders.
Example use case: A mid-market apparel retailer used a 3-step email flow plus a single SMS for opted-in users, with a 10 percent holdout. They discovered SMS shortened time-to-convert for returning customers but had a higher unsubscribe rate for first-time browsers. They adjusted by sending SMS only to customers with prior orders or high intent signals and preserved list quality.
Key judgment: Fix the biggest checkout friction before scaling recovery messaging. Messaging multiplies results but cannot compensate for poor checkout UX.
- Immediate actions: Run a small holdout test for your planned recovery flow and measure incremental revenue over 7 days.
- Quick compliance check: Verify opt-in records and update SMS consent copy using Twilio guidance before sending.
- Segmentation rule: Only send SMS to customers with prior transactions or clear opt-in; use email for broader coverage and richer content.
- Discount policy: Create a guarded discount rule: apply price incentives only when cart value or predicted LTV justifies margin loss.



Ready to Run Successful Marketing Campaigns and Grow Your Business?
Gleantap helps you unify customer data, track behavior patterns, and automate personalized campaigns, so you can increase repeat purchases and grow your business.
Ready to Run Successful Marketing Campaigns and Grow Your Business?
Gleantap helps you unify customer data, track behavior patterns, and automate personalized campaigns, so you can increase repeat purchases and grow your business.