
 Divya Ghughatyal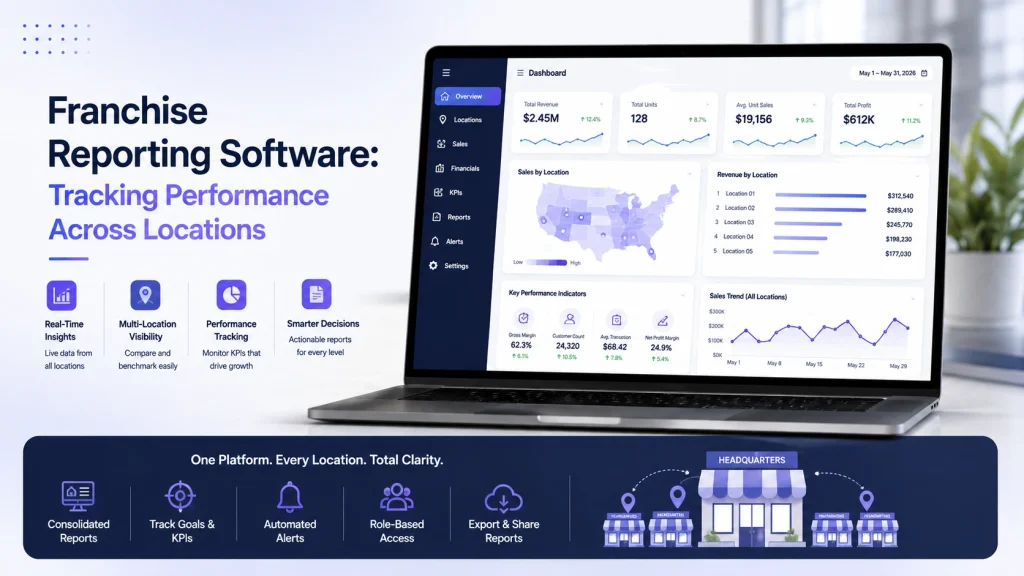
Franchise reporting software turns fractured location-level numbers into a single source of truth so you spot underperformance and stop firefighting. This guide walks franchisors, regional operators, and multi-unit leaders through choosing and implementing a solution, standardizing KPIs, building role-based dashboards, and automating alerts that drive measurable improvements. Expect practical checklists, integration priorities for POS, membership, and CRM systems, and a 30-60-90 rollout you can run as a pilot.
Why centralized franchise reporting drives faster decisions
Centralized reporting with franchise reporting software turns slow, manual decisions into same-day actions. When location data is normalized and available in one place, you stop basing remediation on end-of-month spreadsheets and start acting on the last 48 hours of reality.
What centralized reporting actually removes
- Inconsistent KPIs: reconciliations between franchisees over definitions vanish when the network enforces one formula for each metric.
- Late detection: weekly or monthly rollups hide short-term degradation that becomes irreversible if not caught quickly.
- Siloed attribution: marketing spend, POS, and membership platforms live in separate reports and produce conflicting campaign ROI numbers.
- Manual consolidation: hours of spreadsheet work that add no strategic value are eliminated when the system automates rollups.
Practical insight: the speed benefit only appears when three things are in place — standardized KPI definitions, prioritized integrations for POS/CRM/membership systems, and role-based access to clean rollups. Without clear KPI definitions your dashboards become pretty visualizations of garbage; integration work must prioritize high-impact sources first to show immediate wins.
Practical trade-offs and limitations you must accept
- Governance friction: franchisors gain faster oversight but will hit pushback if franchisees lose perceived control over local reports; plan for anonymized rollups and permissioned access.
- Integration cost vs speed: full, real-time pipelines are expensive; for many networks, near-real-time (15–60 minute) updates hit the right balance between cost and actionability.
- Alert noise: poorly tuned thresholds create alert fatigue; a system that flags every 5 percent dip will be ignored — tune alerts to material business impact.
- Local nuance vs central view: aggregate metrics hide local causes. Always provide drill-downs and local context so franchisees can act rather than disagree with the data.
Concrete example: A regional operations manager using franchise reporting software that combines Toast POS and Mindbody membership data received an automated alert for a 20 percent drop in trial-to-paid conversion at one club. The alert included last 30-day cohort trends and marketing attribution.
Key point: speed comes from clean data pipelines and governance, not from fancy dashboards alone.
Centralized reporting removes repetitive reconciliation tasks and surfaces actionable anomalies sooner. For practical models, see Tableau’s multi-location retail analytics guide and industry write-ups on centralized reporting benefits such as Forbes.
Judgment: do not centralize everything at once. Start with a narrow set of revenue and retention KPIs, pilot 3–10 locations, prove you can reduce time-to-insight and increase intervention success, then expand.** Next consideration: decide whether you need near-real-time feeds for operations or nightly batches for financial reconciliation, because that choice determines architecture, cost, and how fast decisions become practical.

KPI catalogue to standardize across locations
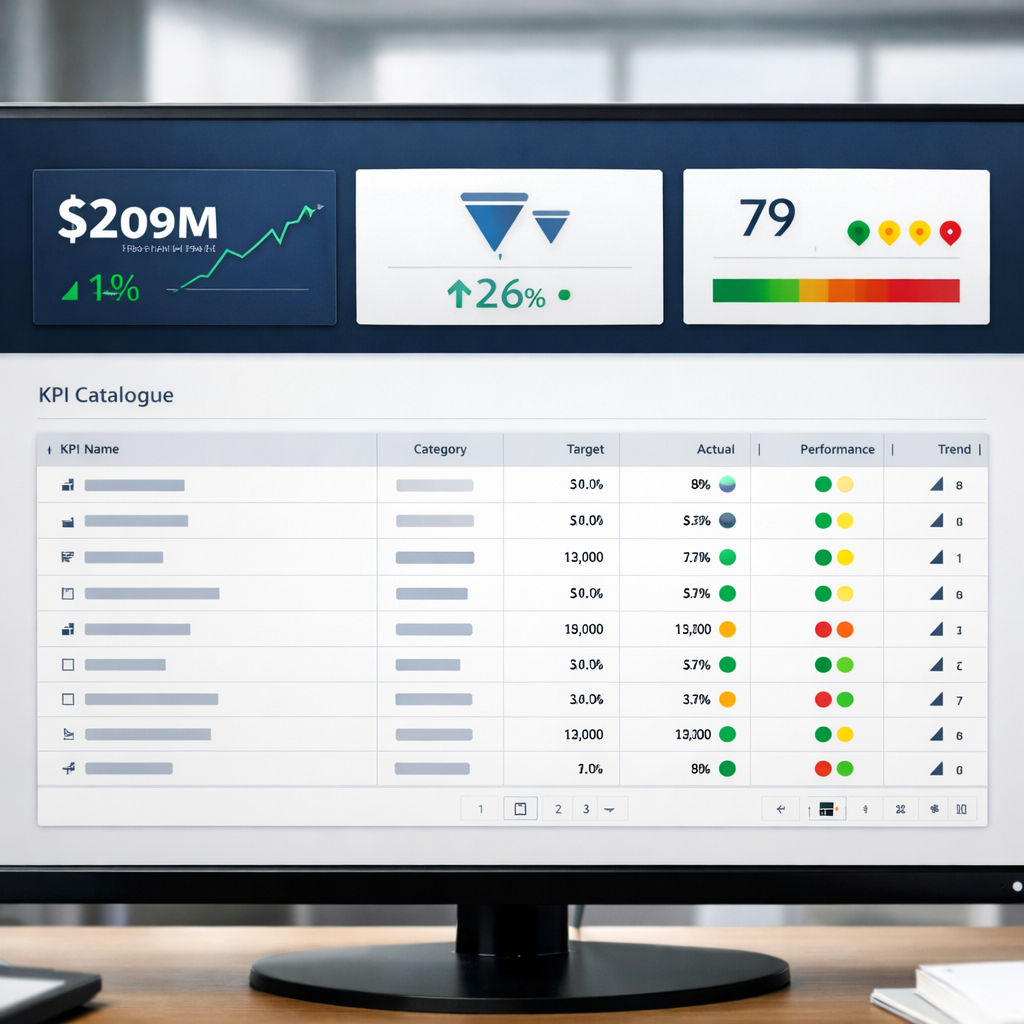
Key point: A KPI catalogue is a single source of truth that defines each metric down to the math, cadence, owner, and raw data field. Without those specifics you will end up with reconciliations and arguments about which spreadsheet was right. The catalogue must live in a central place, versioned, and linked to the actual data source for each location.
What each KPI entry must include
- Metric name and plain formula: exact calculation so everyone measures the same thing
- Cadence: daily, weekly, monthly, or rolling 90 day; include the preferred reporting cutoffs and timezone
- Data source and field mapping: POS system name and field, membership platform table and column, CRM tag or UTM parameter
- Owner: role responsible for the metric and the first responder when it breaks
- Quality checks: acceptance thresholds, reconciliation query or sample rows to validate results
- Target range and action: expected band and what to do when metric moves outside it
| KPI | Formula | Cadence | Owner |
| Revenue per location | Sum(net sales) – refunds | Daily / Monthly | Local manager |
| Same-store sales growth | This month vs same month last year, exclude new locations | Monthly | Regional manager |
| Average transaction value (ATV) | Total sales / number of transactions | Daily | Franchisee |
| New customers per month | Unique new customer IDs with first purchase or first membership | Monthly | Marketing |
| Customer retention rate | Returning customers in period / customers at period start | Monthly / Rolling 90 days | Membership ops |
| Trial-to-paid conversion | Number of trials that converted to paid / total trials started | Monthly | Membership ops |
| Churn rate | Members cancelled during period / active members at period start | Monthly | Finance |
| Marketing-sourced revenue | Revenue attributed to marketing UTM or CRM campaign | Weekly / Monthly | Marketing |
| Local NPS | Survey promoter % minus detractor % | Monthly | Franchisee |
| Labor cost percent | Labor cost / net sales | Weekly / Monthly | Regional manager |
Practical tradeoff: Covering many KPIs is tempting but creates quality debt. Measure fewer metrics well rather than many metrics poorly. Pick a core set that maps to revenue and retention, then add operational KPIs only after the core set is stable for two reporting cycles.
Concrete example: A 25 location fitness brand standardized trial-to-paid conversion with this formula and a monthly cadence. They linked the KPI to the membership platform field that records trial start and to the payment events table for activation. After enforcing the definition, regional managers stopped spending four hours per month reconciling conversion counts and instead ran targeted reengagement sequences on the bottom quartile of locations.
Implementation note: Map each KPI to one canonical data source before you build dashboards. If the POS and membership systems both record a payment, pick the primary source and document the reason. This prevents duplicate counting and avoids messy joins in BI tools like Tableau or spreadsheets.
- Start small: Choose 6 to 10 KPIs that tie directly to revenue and retention
- Document the field mapping: include sample rows and a reconciliation query
- Pilot and validate: run the catalogue in 3 to 5 locations for one month and fix edge cases
- Version and communicate: publish updates and send change notes to franchisees before rollout
Start with a tight catalogue, map each KPI to a single source of truth, and require a validation step before a new KPI is added to operational dashboards.
Next consideration: after the catalogue is locked, spend your implementation effort mapping each KPI to integrations from POS, membership systems, and CRM so dashboards are automated rather than manually reconciled.
Map data sources and prioritize integrations
Start with a system inventory. List every system that records transactions, customers, schedules, payments, inventory, or engagement — POS, membership/scheduling, CRM, payment processor, marketing channels, accounting, and timekeeping. Do this before discussing vendors or dashboards; you cannot prioritize integration work without knowing what exists and who owns each data feed.
Integration prioritization – impact versus effort
Use an impact-vs-effort matrix. Score each source on business impact (revenue/retention insight, compliance, operations) and implementation effort (connector availability, data complexity, vendor cooperation). Focus first on high-impact, low-to-medium-effort sources.
| System | Typical impact | Typical integration effort | Why it matters |
| POS (Square, Toast, Clover) | High | Medium | Primary revenue record and SKUs; needed for same-store sales and AOV |
| Membership / Scheduling (Mindbody, Zen Planner, Club OS) | High | Medium | Customer lifecycle, trial conversions, retention drivers |
| CRM / Engagement (Gleantap, HubSpot) | High | Low | Attribution of marketing and campaign-level member conversions |
| Payment processors (Stripe, Square) | Medium | Low | Payments and fee reconciliation; important for P&L accuracy |
| Marketing platforms (Facebook, Google, email) | Medium | Low | Campaign performance and acquisition cost |
| Accounting (QuickBooks, Xero) | Medium | Medium | Required for consolidated financial reporting and audits |
| Timekeeping / Labor | Medium | Medium | Labor cost and hours mix for margin analysis |
- Phase 1 (must-have): Integrate membership/scheduling and POS first. This combination delivers member-level revenue and retention signals.
- Phase 2 (high-value): Add CRM/engagement and payment processors so you can tie campaigns to revenue and reconcile fees.
- Phase 3 (nice-to-have): Pull accounting, labor, and marketing platform data to complete P&L and efficiency metrics.
Practical trade-off. Prebuilt connectors get you to value quickly but often require you to accept the vendor’s field mappings. Custom ETL gives control over normalization but adds ongoing maintenance. For networks under 50 locations, prefer prebuilt connectors plus light transformation. For 100+ locations or complex menus, budget for custom mapping and an ETL layer.
Normalization checklist. Agree on customer identifiers, product/service catalog alignment, timezone and business day definitions, refund and discount rules, and fiscal period boundaries before you sync data. Failure to normalize these is the most common cause of false alerts and reconciliation churn.
Concrete Example: A 35-location gym chain integrated Mindbody, Square POS, and Gleantap in the first 45 days. Once customer IDs were matched and refund rules standardized, regional managers could see trial-to-paid conversion by source. That single integration revealed two marketing channels with high cost-per-acquisition but poor retention, allowing the brand to reallocate spend immediately.
Key takeaway: Prioritize integrations that produce actionable, member-level insights first — membership systems, POS, then CRM — and use an impact-vs-effort matrix to avoid building low-value connectors.
Common misstep: Teams try to ingest every available feed and then are overwhelmed by schema mismatch and alert noise. Build the minimum set that answers your top operational questions, then expand. If you want examples of multi-location analytics approaches, see Tableau and restaurant-specific reporting guidance from Toast.

Next consideration: Before you build any connector, assign an owner and an SLA for data freshness and error handling — that governance decision costs nothing but prevents half the integration failures you’ll otherwise face.
Design role-based dashboards and report templates
Start with the action each role needs. Executives need trend signals and exceptions, regional managers need prioritized problem lists and drilldowns, and franchisees need a short list of daily actions tied to revenue or retention. Design three to five templates first and treat every additional template as a feature request that must prove adoption.
Design rules that force clarity and action
- Single-screen intent: Each template must answer one question in under 10 seconds – health, opportunity, or risk.
- Top KPIs only: Surface 4 to 6 KPIs with exact formulas included in the template footer for auditability.
- Action widgets: Replace raw tables with action items – for example an underperforming location row links to the root cause report and recommended tasks.
- Consistent time windows: Use standardized rolling windows – 7-day, 30-day, and MTD – so comparisons mean the same thing across roles.
- Drilldown discipline: Allow drilldowns but keep the default view aggregated – franchisees see their location only, regional managers see rollups plus bottom 10 locations.
- Data provenance: Show source system and last refresh time on every dashboard to avoid trust fights.
| Role | Must-have widgets | Refresh cadence | Access level |
| Executive | Network revenue trend, retention trend, top 10 underperformers, marketing ROI | Daily summary with weekly deep-dive | Network rollup, drill to region |
| Regional manager | Location ranking, labor hours vs sales, appointment no-show rate, campaign lift | Daily with real-time alerts for exceptions | Region and location drilldown |
| Franchisee | Check-ins or transactions, new signups, open leads, local campaign performance | Daily refresh – mobile friendly | Location only |
| Finance | P&L rollup, gross margin by location, aged payables | Monthly with ad-hoc export | Aggregates and individual locations as needed |
| Marketing | Campaign attribution, New customer source, LTV by channel | Weekly with campaign-level drilldowns | Campaigns and location mapping |
Tradeoff to accept. Heavy BI visualizations are powerful but slow to adopt at the franchisee level. Purpose-built franchise dashboard software or simpler tools encourage daily use but limit complex ad-hoc analysis. Choose based on whether your immediate goal is adoption or deep investigation.
Concrete example: A 45 location fitness chain integrated Mindbody, POS, and Gleantap to produce a franchisee daily dashboard that lists check-ins, new member trials, and a single-to-do: contact any trial that did not convert last week. Regional managers receive a weekly report that highlights the three locations with the largest drop in trial-to-paid conversion so they can schedule targeted coaching. The result was fewer manual reports and faster local interventions.
- Template checklist: Include KPI definitions, data source, refresh cadence, owner, and a 1 line recommended action for each widget.
- Distribution plan: Map templates to delivery channels – in-app for franchisees, email digest for executives, Slack alerts for escalations.
- Pilot and measure: Run a 4 week pilot with 5 franchisees and one region. Measure daily active users, time to first action on alerts, and reduction in weekly manual reporting time.
Key takeaway: Build narrow, role-focused dashboards that prespecify actions. Prioritize adoption over analytics depth early, then add investigative workspaces for power users.

Next consideration: Pick the highest value role to pilot – usually franchisees for adoption or regional managers for operational leverage – and build one template using a tool that supports easy distribution and governance, whether that is a BI tool like Tableau or a purpose-built platform integrated with your membership system.
Automating reports, alerts, and anomaly detection
Key point: Automating reports and alerts moves your team from firefighting to focused intervention, but automation that is naive creates more noise than value. Configure schedules, thresholds, and escalation paths deliberately, and treat the automation layer as an operational tool that must be tuned, audited, and governed.
Alert design patterns and escalation
Design rule: Start simple, then add sophistication. Use threshold alerts for immediate operational failures and trend-based detection for subtler performance deterioration. Threshold alerts are easy to explain to franchisees – they act quickly. Trend alerts catch slow declines that thresholds miss.
- Daily operational alerts: Revenue drop greater than 15 percent versus same day last week – notify regional manager and franchisee via Slack and email.
- Customer funnel alerts: New member signups drop for three consecutive days – trigger an automated SMS checklist to franchisee with recommended actions.
- Compliance alerts: Missing daily P&L upload or reconciliation – escalate to franchisor operations with 48 hour SLA.
- Resource alerts: Labor hours to sales ratio exceeds target for two consecutive weeks – add to monthly operations review for that location.
Practical tradeoff: Thresholds are fast to implement but fragile around seasonality and local events. Reduce false positives with a cool-down window, compare to rolling baselines rather than single prior-day comparisons, and require two consecutive violations before escalation for noncritical alerts.
Concrete example: A 35 location fitness network implemented a daily revenue alert set at 20 percent below a 28 day rolling median, with a 24 hour cool-down. When a location tripped the alert, the system sent a Slack message to the regional manager and an automated SMS to the franchisee including a one page troubleshooting checklist and a link to the location dashboard. In the first 90 days the team resolved 62 percent of alerts without a site visit, and the remaining incidents had faster investigation because the alert included relevant POS and membership snapshots.
Anomaly detection – what works in practice
Reality check: Complex machine learning models sound attractive but often add cost and opaque results. For most franchise networks, seasonality-aware statistical rules and simple predictive baselines deliver the best cost to benefit ratio. Reserve advanced predictive analytics for well instrumented, high volume signals where labeled incidents exist.
Implementation guidance: Use rolling medians, day-of-week seasonality adjustment, and z-score windows as your first layer. Add short term forecasting to flag expected versus actual deviations. If you choose vendor ML, require explainability and a false positive rate SLA, and validate models against historical incidents before production.
Data quality constraint: Alerts are only as good as the data feeding them. Expect gaps from delayed POS batches, manual refunds, or mis-tagged products. Build pre-alert validation checks that mark data as stale and suppress alerts until reconciliation finishes. Maintain an audit log so every alert links back to raw transactions and reconciliations.
Avoid alert fatigue: aim for fewer than one actionable alert per location per week. More alerts mean fewer real responses.
Operational success metrics: track alert precision (true positives divided by total alerts), mean time to acknowledge, percentage of issues resolved remotely, and reduction in manual report hours. Target alert precision above 85 percent and alert resolution within 48 hours for critical items.
Next consideration: After you tune alerts and basic anomaly rules, link each alert to a prescriptive playbook and a measurable SLA. Automation without an operational response process simply creates deliverables that collect dust.
Governance, access control, and data quality processes
Governance must be designed to protect data integrity without turning every report into a permissioned bureaucracy. Practical governance balances three things: clear ownership, automated validation, and lightweight approval paths so local teams can act quickly while corporate retains auditable oversight.
Roles, access control, and sensible limits
Define four access tiers up front: franchisor (network-wide rollups and anonymized drill), regional manager (cluster-level data and exceptions), franchisee (their location-level KPIs and operational alerts), external accountant (financial packs and read-only P&L). Assign every user to a single primary role and one optional secondary role for temporary escalations.
| Role | Typical permissions | When to grant |
| Franchisor | Network rollups, anonymized drill-down, change KPI definitions | Corporate analytics, strategy, compliance |
| Regional manager | Cluster reporting, alerts, approve data corrections | Operational oversight and coaching |
| Franchisee | Location dashboards, export their raw data, submit exceptions | Day-to-day operations |
| External accountant | Read-only financial reports, export P&L | Quarterly audits or tax prep |
Trade-off to accept: strict locking prevents abuse but slows local problem-solving. The practical choice is role-based write paths for data corrections with a timestamped audit trail rather than full write-access for everyone.
Data quality rules, reconciliation cadence, and source-of-truth
Tag a single source-of-truth for each KPI and enforce it with automated rules. For revenue use POS gross receipts; for active members use the membership system. Where systems disagree, create a reconciliation rule that prefers one source and records the divergence for review.
- Daily automated checks: balance POS receipts to payments processed, flag >2 percent variance.
- Weekly reconciliation: membership counts versus check-ins with a >5 percent variance trigger for local review.
- Monthly financial pack: P&L rollup reconciled to bank deposits and payment processor reports before sign-off.
Practical validation examples: implement simple SQL or rule-based checks that run overnight: verify location timezone alignment, product/service mapping consistency, and customer ID deduplication across CRM and membership platforms. These are not academic checks; they catch the most common causes of bad rollups.
Concrete example: A 60-location fitness brand found recurring revenue variance between their membership platform and POS because promotions were recorded differently. They implemented a daily reconciliation that compared active-subscription totals to POS recurring charges and set a 3 percent variance alert to the regional manager. The result was fewer month-end journal entries and faster resolution of billing configuration errors.
Common misunderstanding: teams assume data quality is a one-time cleanup. It is ongoing. Expect drift when catalogs, SKUs, or promotion codes change. Build lightweight change-control: a short form that must be submitted before any pricing or product-code change, which triggers an automated schema and KPI impact check.
Key governance rule: enforce data contracts—who owns the source, the exact field definition, the cadence, and the expected variance threshold—for every KPI you report.
Quick checklist: implement SSO and RBAC, schedule daily automated validation jobs, require timestamped correction requests with approval, run quarterly access reviews, and document the canonical source for each KPI. Use audit logs for disputes.
Tooling and links: choose franchise reporting software that supports RBAC, audit logs, and data lineage. For visualization and lineage capabilities consider platforms like Tableau and connect CRM flows to reporting with a partner.
Next consideration: after you lock definitions and automate checks, schedule the first access and data-quality review within 30 days of rollout to catch permission mistakes and early drift.
Implementation roadmap and success metrics
Start with a staged rollout, not a big bang. Build confidence and reduce risk by proving the data model and reporting workflows in a pilot before committing to network-wide integrations and customization.
30-60-90 day breakdown
- Days 0–30: Discovery and KPI alignment – Lock the 6 to 10 core KPIs with exact formulas, cadence, and ownership. Map which source system owns each field and capture sample extracts from 3 representative locations.
- Days 31–60: Integrations and prototype dashboards – Implement highest-impact connectors (example: membership + POS + payments). Build a lightweight daily dashboard and automated daily digest for pilot users. Run reconciliation scripts nightly and flag mapping problems.
- Days 61–90: Pilot, iterate, and scale plan – Run the pilot for 6–10 locations, measure adoption and data fidelity, then freeze the template and produce a roll-out playbook for the broader network.
Tradeoff to manage: prioritize connectors that move revenue and retention signals faster rather than chasing perfect historical alignment. Early wins come from getting reliable, timely numbers for a few KPIs rather than full-schema parity across everything.
Pilot success criteria and operational SLAs
- Data freshness SLA: source-to-dashboard latency under 24 hours for daily KPIs and under 4 hours for critical alerts.
- Adoption KPI: at least 75 percent of pilot franchisees log into their daily dashboard at least 3 times a week.
- Reconciliation reduction: decrease manual month-end reconciliation time by 40 percent for pilot locations.
- Alert resolution: 80 percent of high-priority alerts acknowledged within 24 hours and resolved within 72 hours.
Concrete example: A 25-location boutique fitness brand integrated Mindbody and Stripe for a 10-location pilot. After 60 days they cut weekly reconciliation work from 12 hours to 4 hours per regional manager, and trial-to-paid conversion for pilot sites rose 12 percent after targeted retention campaigns driven by the new reports.
Vendor and cost checklist (practical judgment)
| Selection criteria | Why it matters | Minimum acceptable target |
| Prebuilt connectors for Mindbody/Toast/Stripe | Reduces implementation time and custom ETL work | Connector exists and can sync required KPI fields |
| Role-based dashboard templates | Speeds adoption and lowers training cost | Templates for franchisor, regional, and franchisee |
| Support and onboarding hours | Most projects fail from lack of hand-holding | Dedicated onboarding with SLA for first 90 days |
| Data security and compliance | Protects franchisee and customer PII and limits legal risk | SOC 2 or equivalent and clear data ownership terms |
| Total cost of ownership | Licensing plus integration and maintenance determine long-term viability | Compare vendor estimates against in-house build for 3-year TCO |
Limitations you must accept early. Expect manual exceptions for 6–12 weeks while product catalogs, customer identifiers, and timezone issues are resolved. Trying to eliminate every discrepancy before launch will stall the program and erode trust.
Quick measurable targets: Reduce reconciliation hours by 30–50 percent, achieve 75 percent pilot login adoption, improve at least one revenue or retention KPI by 10 percent in pilot sites, and meet data freshness under 24 hours. These are realistic signals that the reporting platform is operationally useful.
Next consideration: after a successful pilot, lock the rollback and escalation playbook, formalize training tied to dashboard tasks, and schedule quarterly KPI reviews so the metrics remain relevant as the business changes. For additional reading on multi-location analytics approaches, see Tableau multi-location retail analytics.
Frequently Asked Questions
Practical answers beat theory. These FAQs focus on decisions you will make during selection, rollout, and day-to-day operations of franchise reporting software — not high-level definitions.
Implementation and vendor choice
- Should we build reporting in-house or buy a purpose-built platform? Buy when you want fast time-to-value, prebuilt connectors, and vendor support for ongoing maintenance. Build only if you have dedicated engineering and a roadmap to maintain connectors, mappings, and change management – most franchises underestimate ongoing integration costs.
- How many locations justify a vendor? There is no fixed cutoff, but in practice 50+ locations or rapidly scaling networks benefit from a vendor because per-location integration and SLA management become a full-time job. Smaller networks can start with BI connectors and migrate later.
- What about per-location pricing versus seat or network pricing? Per-location pricing scales predictably but creates sticker shock as you grow. Seat-based or tiered network pricing can be cheaper at scale but may limit access. Match pricing to who actually needs daily access – avoid paying for dashboards viewed once a month.
Data, privacy, and access
- Can franchisors see franchisee-level raw data? Legally and technically yes, but you should limit access via role-based controls and contractual language. Prefer aggregated rollups for network-wide analysis and explicit clauses in franchise agreements for any access to personally identifiable information.
- How do you handle offline or intermittent POS connectivity? Use systems that support local buffering and delayed sync. Expect reconciliation windows for late transactions – do not assume real-time totals will be accurate for short-term alerts without an allowance for sync lag.
Operations, alerts, and adoption
- How do we prevent alert fatigue? Prioritize alerts that require action – revenue drops greater than a business-specific threshold, payroll variances, and campaign failure signals. Add a quiet period for transient fluctuations and require escalation criteria so alerts turn into tasks, not noise.
- What drives franchisee adoption? Lightweight, local action items beat heavy BI reports. Give franchisees a daily checklist widget, a simple drill-down, and a 15-minute onboarding that shows how the dashboard saves them time.
Concrete Example: A 120-location fitness brand used a vendor connector to stream membership and POS data. When a regional manager received a 15 percent week-over-week revenue drop alert, the protocol required a 24-hour verification window to allow for delayed transactions, then an automatic ticket to check cancellations, local marketing changes, and staff scheduling. That sequence turned noisy alerts into three-minute investigations and one local promotional fix that recovered 60 percent of the loss within two weeks.
Limitation and trade-off: Real-time reporting is attractive but costly to maintain and fragile across diverse POS and membership systems. In many networks the right compromise is near-real-time (hourly) for operational dashboards and end-of-day for financial close. Expect higher vendor fees and engineering effort if you insist on strict sub-minute consistency.
Common misunderstanding: People assume more KPIs equal better control. In practice excess metrics produce conflicting guidance and low data quality. Focus reporting on metrics that map directly to decisions you can act on at the franchise level – revenue, retention, conversion, and labor efficiency.
Key decision rule: If integrations with membership systems and POS deliver the customer and revenue view you need, prioritize that connector first.
Next steps you can implement this week
- Map one high-value connector: Identify the single system – POS or membership – that, once integrated, will eliminate the most manual reconciliation. Start there.
- Define three action KPIs: Choose one revenue, one retention, and one operational KPI and lock their formulas in a shared doc so everyone reports the same numbers.
- Set one alert rule and an escalation path: Create a threshold-based alert for a meaningful failure mode, add a 24-hour verification window, and assign the first responder role.



Ready to Run Successful Marketing Campaigns and Grow Your Business?
Gleantap helps you unify customer data, track behavior patterns, and automate personalized campaigns, so you can increase repeat purchases and grow your business.
Ready to Run Successful Marketing Campaigns and Grow Your Business?
Gleantap helps you unify customer data, track behavior patterns, and automate personalized campaigns, so you can increase repeat purchases and grow your business.