
 Divya Ghughatyal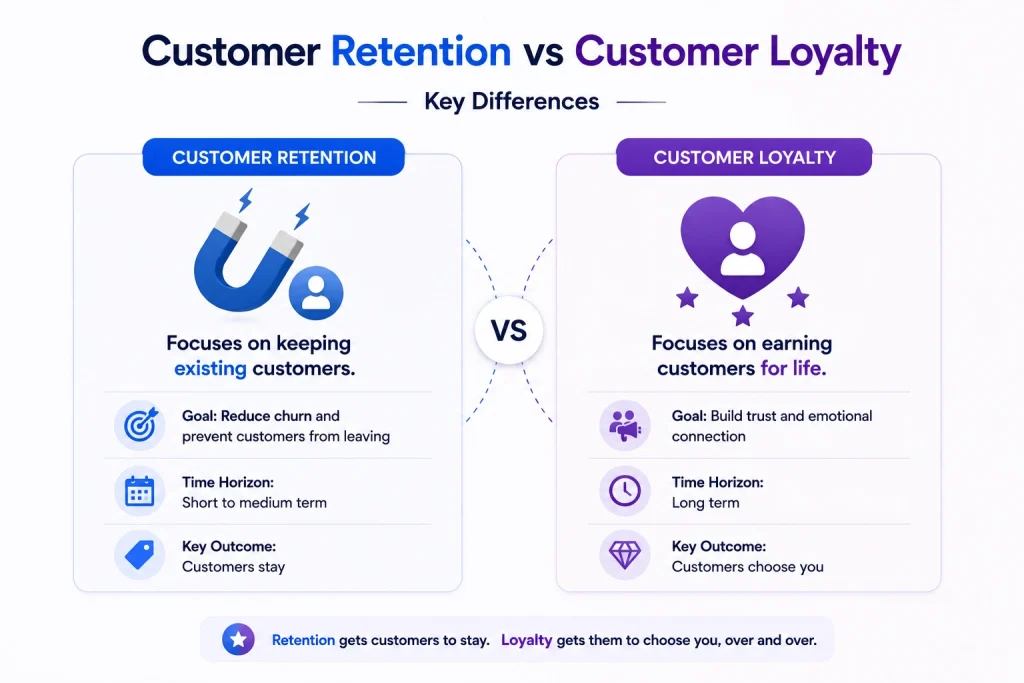
Marketing teams often confuse customer retention vs loyalty, treating the two as interchangeable and spending on tactics that solve different problems. This post maps each concept to the metrics, time horizons, and tactics that actually move revenue, with concrete playbooks for retention automation, loyalty programs, and a prioritized 30-60-90 day plan you can test this quarter. Expect measurable KPIs, sample messages, and real-world examples from fitness, retail, and subscription brands to decide what to fix first.
Operational definitions and metrics: Customer retention versus customer loyalty
Clear distinction: Customer retention is a behavioral metric set – it measures whether customers come back and spend again over defined windows. Customer loyalty is an attitudinal and value-based concept – it measures emotional commitment, advocacy, and share of wallet that make customers less price sensitive and more likely to refer others.
Metric formulas and what to track first
Retention formulas: Monthly churn = lost customers during month ÷ customers at start of month. Period retention rate = 1 – churn for the same window. Cohort retention = returning customers in cohort period ÷ cohort size. Repeat purchase rate = customers with 2+ purchases ÷ total customers in period.
Loyalty measures: NPS = % promoters minus % detractors from survey responses. Referral rate = customers who referred ÷ active customers. Share of wallet is measured as spend with your brand ÷ total category spend for that customer, usually via survey or panel data.
| Metric | Primarily measures | Why it matters |
| Churn rate | Customer retention | Direct signal of revenue leakage and where to focus recovery tactics |
| 30/90 day cohort retention | Customer retention | Shows early product-market fit and onboarding effectiveness |
| Repeat purchase rate | Customer retention | Simple business outcome metric for transactional brands |
| NPS | Customer loyalty | Proxy for emotional loyalty and likely future referrals |
| Referral rate | Customer loyalty | Measures advocacy and organic acquisition potential |
| Share of wallet | Customer loyalty | Indicates how deeply a customer chooses your brand over competitors |
- Practical insight: Track a short list of retention KPIs weekly – churn, 30 day retention, and repeat purchase rate – because they are actionable and respond quickly to flows and offers.
- Tradeoff to accept: Loyalty metrics require time and samples. Investing heavily in a points program before stabilizing retention is a common mistake because loyalty signals only become meaningful after consistent repeat behavior over months.
- Measurement limitation: NPS and surveys suffer from response bias and lag. Use them to triangulate loyalty trends, not to evaluate the short term success of a winback email or cart recovery flow.
Concrete example: Golds Gym used targeted onboarding and automated reactivation messaging to stop short term churn and lengthen membership tenure; those are retention actions that reduce immediate revenue loss. By contrast, Starbucks Rewards is structured to build loyalty through tiers and points that change long term purchase patterns and share of wallet.
Judgment that matters: If your churn is materially above industry benchmarks or your unit economics are fragile, prioritize retention metrics and flows first. Loyalty programs amplify existing retention when retention is already healthy – they do not substitute for poor onboarding or unresolved product issues.

Next consideration: Pick one retention metric you can move in 30 days and one loyalty metric to measure over 6 months – design experiments that map short term flows to long term sentiment so you do not optimize for transactions at the expense of brand trust.
Five dimension comparison with concrete examples
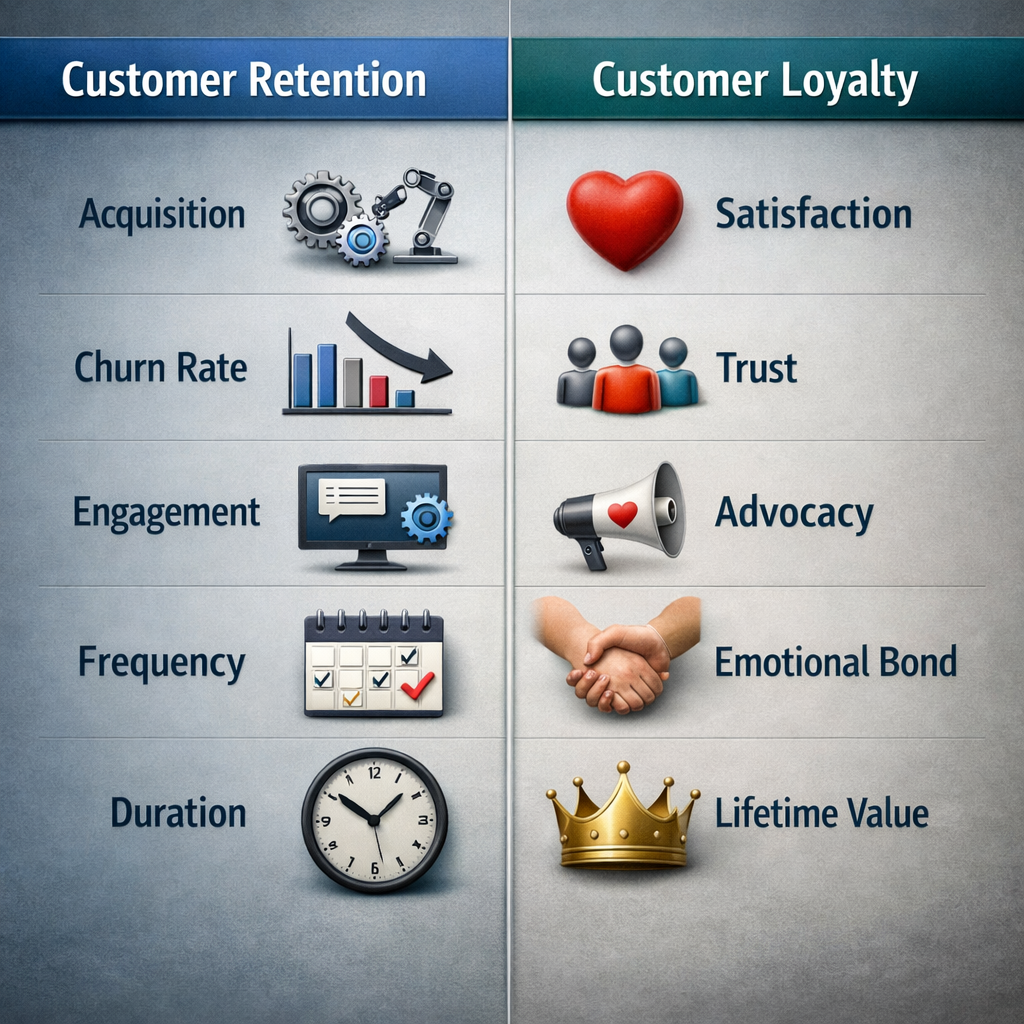
Concrete point: Customer retention and customer loyalty look similar on the surface but pull different levers — one fixes behavior this quarter, the other changes how customers value your brand for years.
Side-by-side: five dimensions
| Dimension | Customer retention (practical metrics and sample) | Customer loyalty (practical metrics and sample) |
| Measurement | Primary KPIs: churn rate, cohort retention, repeat purchase rate. Sample calc: monthly churn = lost customers / starting customers; starting 1,000, lost 80 → churn 8%. | Primary KPIs: NPS, referral rate, share of wallet, repeat purchase elasticity. Note: sentiment leads observed advocacy, not immediate revenue. |
| Timeframe | Weeks to quarters — retention moves fast and shows up in 30/60/90 day cohorts. | Months to years — loyalty emerges slowly and shows in multi-year LTV and lower price sensitivity. |
| Drivers | Rational drivers: price, convenience, reminders, friction removal. | Emotional drivers: identity, trust, community, consistently superior experience. |
| Tactics | Automation-led: onboarding sequences, cart recovery SMS, winback emails, churn-triggered offers. | Program-led: points/tiers, VIP events, exclusive access, product ecosystems that reward advocacy. |
| Business impact | Immediate CAC recovery and short-term revenue stabilization; improves unit economics quickly. | Greater lifetime value expansion and margin resilience; reduces acquisition dependence but requires investment. |
Practical trade-off: Retention tactics are the low-hanging fruit — they are cheaper to run and measurably lift revenue fast, but they often produce transactional repeat customers who will leave for a better deal. Loyalty investments cost more and take longer to prove, but they change customer behavior in ways that survive price competition.
Concrete example: Starbucks Rewards turns routine buyers into habitual customers by combining small, frequent rewards with frictionless mobile ordering and personalization. That mix increases visit frequency and makes members less price-sensitive. Another use case: Sephora Beauty Insider layers tiered points with exclusive events and early product access to convert high-intent shoppers into brand advocates who refer friends and spend across categories.
- Measurement consideration: Do not treat NPS and short-term retention as interchangeable — NPS predicts advocacy but not necessarily immediate repeat purchases; run both with cohort alignment.
- Budget allocation: If monthly churn is above your unit-economics threshold, prioritize retention automation for 60 days before funding a full loyalty program.
- Program design warning: Points programs without meaningful experiences become discount engines — pair points with exclusive, hard-to-copy benefits to protect margin.
If you need a rule of thumb: fix retention first when churn threatens payback windows; invest in loyalty once retention stabilizes and you can forecast multi-year LTV gains. For evidence on how focusing on the right customers increases value.
Key takeaway: Treat the five dimensions as decision gates. Use retention metrics to triage urgent revenue leakage and loyalty metrics to justify longer-term program spend and experiential investments. If you skip one or the other, you either waste money on points that don’t move behavior or patch churn without building advocacy.
When to prioritize retention and when to invest in loyalty: a decision framework
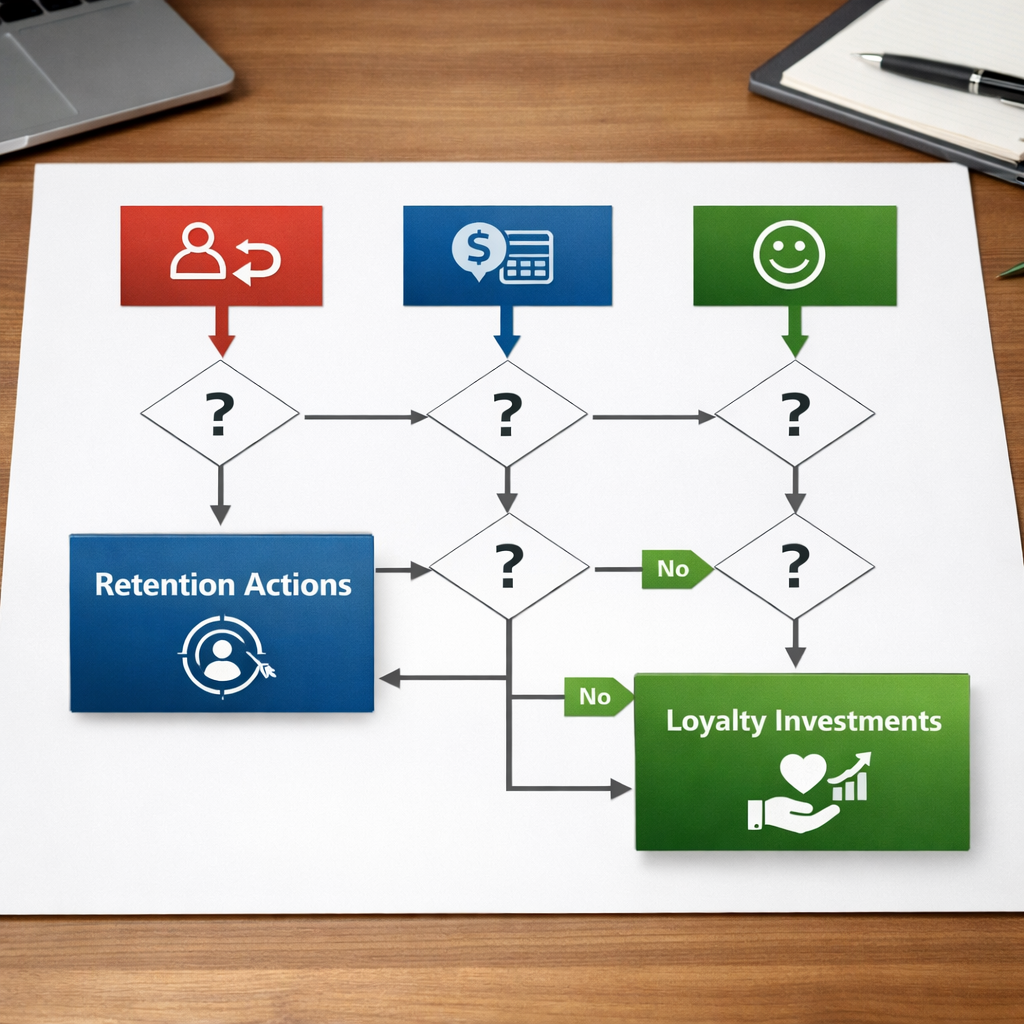
Start with the failure mode you must fix first. If your business is bleeding customers faster than you can acquire them, focus on retention. If churn is low and customers still switch brands on price, invest in loyalty. This is a pragmatic, money-first rule: plug revenue leaks before you fund long-term emotional investments.
Core decision triggers you can measure this afternoon
- Monthly churn > 3–5 percent: Prioritize retention tactics such as onboarding flows, automated winbacks, and cart-abandon recovery. High churn signals unit-economics instability.
- LTV:CAC < 3: Focus on retention and cheaper reactivation channels until economics improve. Loyalty programs add fixed costs and should follow stable payback.
- Repeat purchase rate below category median: Fix product, pricing, or convenience issues first. Short-term retention moves are more effective than launching a points program to cover operational problems.
- NPS consistently > 40 and low churn: You can scale loyalty investments. A healthy NPS plus stable retention indicates customers are receptive to emotional and advocacy bets.
- High acquisition cost growth or saturated channels: When finding new customers gets expensive, loyalty and share-of-wallet strategies extract more value from existing base.
Practical trade-off to accept. Retention tactics deliver faster, measurable ROI but hit diminishing returns. Loyalty programs scale lifetime value but require upfront design, ongoing margins for rewards, and coherent brand experience. Many teams try to do both badly; choose one to execute well.
Resource allocation by business stage
| Stage | Primary focus (first 90 days) | Budget split (retention : loyalty) | Key KPIs to watch |
| Early-stage subscription or new D2C | Stabilize cohorts with onboarding, welcome offers, and recovery flows | 80 : 20 | Monthly churn, 30-day retention, CAC payback |
| Scaling mid-market | Automate retention flows, pilot referral or small loyalty mechanic | 60 : 40 | LTV:CAC, repeat purchase rate, referral conversion |
| Mature brand with low churn | Design full loyalty program and experiential tiers | 40 : 60 | NPS, share of wallet, membership retention |
Concrete example: A mid-market meal-kit D2C with 6 percent monthly churn and LTV:CAC of 1.8 should pause loyalty program launches. The immediate priority is a 7-day onboarding sequence and a 14-day winback SMS automated flow to lower churn; those moves typically improve payback and free budget for a loyalty pilot after 60–90 days. After stabilizing retention, run a controlled pilot of a simple tiered rewards mechanic and measure incremental LTV by cohort.
Key trigger to flip focus: when 90-day cohort retention improves by 10–15 percent and LTV:CAC exceeds 3, start shifting meaningful budget into loyalty program design and experience investments. Use cohort tests to avoid misattribution.
What teams commonly misunderstand. Brands often launch points programs to boost repeat purchases when the real issue is poor delivery or service quality. Loyalty rewards cannot mask bad experience; they accelerate spend only when basics are stable. If service quality is shaky, spend on retention tactics that reduce churn and recover revenue before designing emotional rewards.
Next consideration: run simple A/B tests and cohort comparisons whenever you shift budget from retention to loyalty — that is the only defensible way to show incremental LTV.
Channel level playbooks with sample messages and outcomes
Channels are tactical levers: use SMS and email to stop churn now, and use in-app, community, and events to compound emotional loyalty over months. Treat each channel according to the immediate objective — revenue recovery or relationship building — and design cadence, creative, and metrics accordingly.
Retention playbook: high-velocity flows that pay back fast
- 7 day onboarding series (email + push): Day 0 welcome email with clear next step, Day 2 quick-start SMS with one-click offer, Day 6 push reminding benefit use. Goal: increase 7 to 30 day activation and reduce early churn.
- Cart abandonment (email + SMS): Send at 30 minutes, 24 hours, 72 hours. Sample SMS: Buy now and get 10 percent off your cart. Outcome: 10 to 30 percent recovery on abandoned carts depending on category.
- 14 day winback SMS + email: Short, personalized SMS on day 14 with incentive and link; follow with segmented email at day 21 with product recommendations. Expected lift: 5 to 20 percent incremental revenue in targeted cohort.
Practical constraint: SMS is high ROI for recovery but burns goodwill when overused. Limit automated recovery blasts to 2 to 3 per lifecycle event and include clear opt down options.
Loyalty playbook: channels that build advocacy and share of wallet
- Tiered points program (email + in-app): Announce tier progress by email, surface next reward in-app, trigger milestone push when a tier is reached. Metric: increase frequency and share of wallet over 6 to 12 months.
- Referral program (email + SMS): One-touch referral link via SMS after positive interaction. Sample message: Invite a friend, you both get $10 credit when they buy. Use A B tests to validate lift vs cost.
- Community and experiential (social, events, in-app): Promote exclusive events and early access through email and social. This drives emotional loyalty and advocacy rather than immediate revenue.
Trade-off: Loyalty channels require budget and a longer measurement window. If your churn is above benchmark, prioritize retention flows first; invest in loyalty only once you can measure incremental LTV reliably.
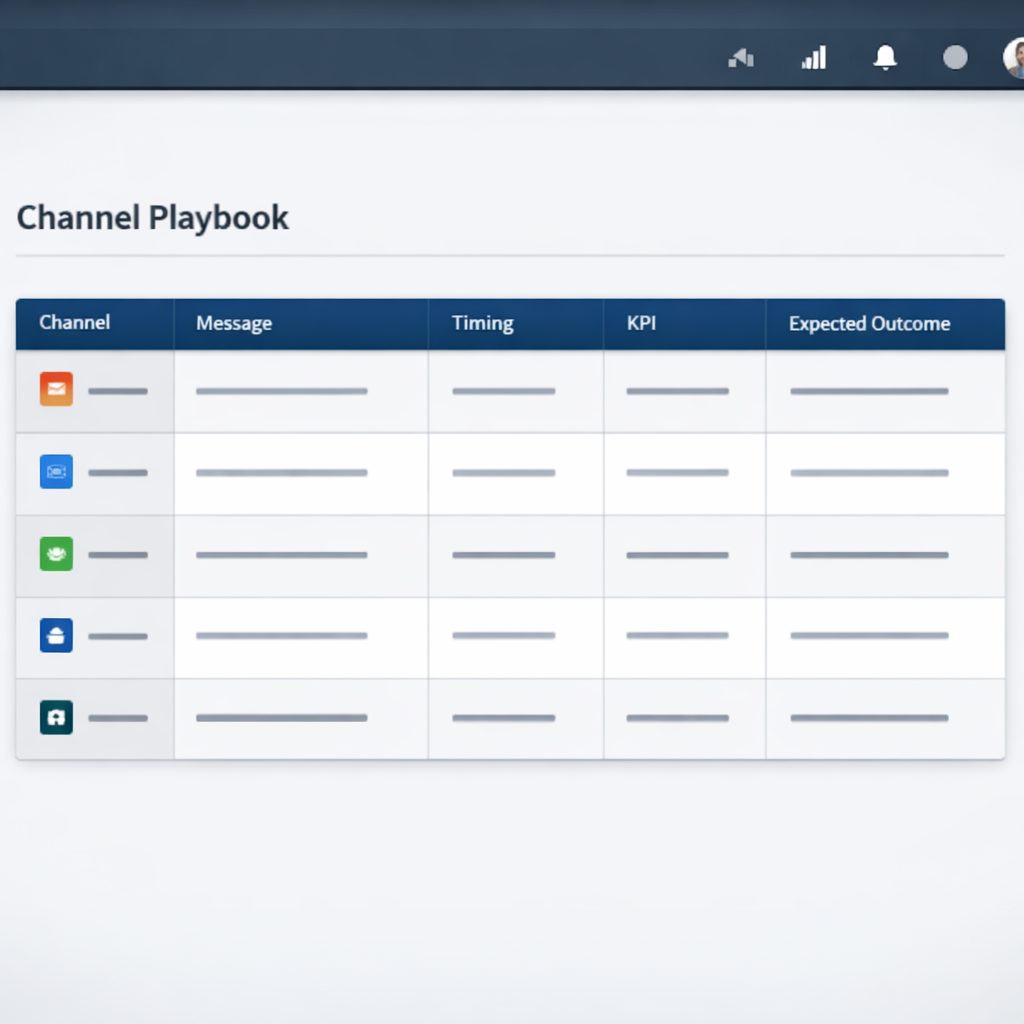
| Channel | Sample message / timing | KPI to watch | Expected short term outcome |
| Welcome email Day 0; onboarding content Day 2 | 7 day activation, 30 day retention | 5 to 15 percent lift in activation | |
| SMS | Cart abandon 30 min + 24 hr; 14 day winback | Recovered orders, short term revenue | 10 to 30 percent cart recovery |
| Push / In-app | Milestone push when near reward; personalized product nudge | DAU engagement, repeat purchase rate | 3 to 10 percent uplift in immediate visits |
| Social / Events | Invite to exclusive event or beta | Referral rate, NPS, advocacy | Slow build in referrals and share of wallet |
Concrete Example: Starbucks uses push and email to nudge customers toward double-reward days and limited offers. Those messages drive frequency spikes in the short term while the underlying tier mechanics increase spend over quarters. In practice, short-term messaging recovers visits; tiered rewards convert that extra frequency into higher lifetime value.
Important: Always measure incremental lift with controlled tests. Use cohorts and holdout groups for each channel flow and measure at appropriate windows: 30 days for retention flows, 3 to 12 months for loyalty programs.
Operational judgment: Do not collapse loyalty messaging into the same cadence as retention automation. Keep loyalty communication sparser, more narrative, and value-forward. If a message reads transactional, it will move short-term metrics but will not create brand affinity.
Next consideration: Pick one retention flow and one loyalty pilot to test in parallel, instrument with cohorts, and set explicit success thresholds before you scale.
Metrics, dashboards and sample calculations marketers can implement today
Start with two dashboards. One focused on short term behavioral retention metrics that drive immediate revenue, and a second focused on loyalty signals that predict long term value and advocacy. Both are necessary; they answer different questions and require different cadence and tests.
Core formulas and worked examples
Churn and retention formulas. Monthly churn = lost customers during month divided by customers at start of month. Monthly retention = 1 minus churn. Example calculation: starting customers 1,000, lost 80 => monthly churn = 80 / 1,000 = 8 percent, monthly retention = 92 percent.
Repeat purchase and NPS. Repeat purchase rate = customers with 2+ purchases in window divided by total buyers. NPS = percent promoters minus percent detractors. Example: 55 percent promoters, 20 percent detractors => NPS = 35.
Customer lifetime value worked example. For an e commerce brand: average order value 50, purchase frequency 1.5 per year, gross margin 50 percent, expected lifetime 3 years. LTV = 50 1.5 0.5 3 = 112.50. Use a subscription formula for monthly churn: average lifetime months = 1 / monthly churn. Then LTV = ARPU per month gross margin * average lifetime months.
- Eight KPIs to surface now and why each matters: New customers per week – tracks acquisition velocity; Churn rate – immediate risk; 30 day retention – quick health signal; Repeat purchase rate – buying behavior; Revenue retention – monetary impact; LTV – planning and budget; NPS – loyalty sentiment; Referral rate – early advocacy indicator.
- Cadence guidance: Track New customers, Churn rate, 30 day retention and Revenue retention weekly. Track LTV, NPS and Referral rate monthly or quarterly depending on sample size.
- Targets to aim for: Benchmarks vary by industry, but an immediate goal is a 5 to 10 percent relative improvement in 30 day retention from automation flows within 60 days.
Cohort retention table you can paste into a sheet
| Cohort | Month 0 | Month 1 | Month 2 | Month 3 |
| Jan 2026 – new buyers 1,000 | 100.0 percent | 42.0 percent | 28.0 percent | 22.5 percent |
| Feb 2026 – new buyers 950 | 100.0 percent | 45.5 percent | 30.1 percent | 24.0 percent |
| Mar 2026 – new buyers 1,100 | 100.0 percent | 47.2 percent | 32.0 percent | 25.8 percent |
Attribution and lift testing. Do not rely on last click or simple before after comparisons for retention or loyalty investments. Use cohort based lift tests with a control group held out for the same time window. Example approach: randomize 10 percent of eligible customers into control, run the retention flow on the remainder, compare 30 and 90 day retention and incremental revenue per customer. That gives causal lift and prevents us from crediting general seasonality.
Practical trade offs. Small retention improvements are cheap and fast but often have diminishing returns within the same channel. Loyalty initiatives require more time and budget and are harder to measure quickly, so run them as pilots with clear KPI gates. If you have limited sample size, prioritize retention automation and basic referral pilots before rolling out an expensive tiered program.
Concrete use case. Dollar Shave Club style subscription business: implement a 30 day onboarding email series plus a 14 day payment-failure recovery flow. Build a cohort dashboard to compare subscribers who received the flows versus a randomized control. Expect the recovery flow to reduce involuntary churn by a measurable percent in 30 days and improve LTV calculated using the subscription churn formula.
Key takeaway: Track a compact set of behavioral metrics weekly and loyalty signals monthly. Use cohort lift tests to prove impact before scaling loyalty spend.
Next consideration. Pick the three KPIs you will improve in the next 30 days, wire them into a cohort dashboard, and run a single randomized lift test for your highest impact retention flow before designing a full loyalty program.
Real world case studies and what to copy from them
Direct lesson: real brands split the problem—use retention automation to stop churn fast and loyalty design to compound value over years. Trying to buy both outcomes with one tactic fails. Retention flows rescue behavior; loyalty programs change the relationship. Copy the separation; map short windows (30–90 days) to automation and multi‑year horizons to loyalty investments.
Golds Gym (retention automation) — what to copy
Concrete example: Golds Gym used targeted SMS and email flows to recover dormant members and increase visit frequency. The campaign focused on segmented winback sequences, timed onboarding nudges, and class reminders tied to last‑visit behavior. What you can copy: a lightweight segmentation rule set (last visit, membership tier, class interest) and three automated flows: onboarding, 14‑day drip, and a 30‑day winback with escalating incentives.
Practical insight: automation is cheap and measurable. Start with one channel (SMS or email) and one goal (increase visits in 30 days). Use cohort lift tests to prove value before adding discounts or long‑term loyalty mechanics.
Starbucks, Sephora, Amazon Prime — what scales and what to avoid
Starbucks copy: reward frequency not just spend. Starbucks Rewards ties mobile ordering, prepayment, and app convenience to points — that combination increases habit, not just transactions. Copy: build a friction-reducing reward (mobile reorder, free delivery threshold) before extravagant experiential tiers.
Sephora copy: tiered experiential benefits drive advocacy. Sephora uses personalized perks, early access, and sampling to convert repeat buyers into advocates. Copy: use inexpensive experiential rewards (events, exclusive content) to increase emotional loyalty without cutting margins through constant discounts.
Amazon Prime copy: bundling services creates inertia. Prime is effective because multiple utilities reduce the desire to churn. Watch out: bundling demands scale and recurring value—don’t mimic Prime unless your unit economics support ongoing service costs and a clear cross‑sell engine.
- What to copy immediately: implement segmented winback flows, tie rewards to frequency or behavior, and run cohort lift tests before broad rollouts.
- What to delay or avoid: large upfront loyalty discounts that erode margin, overcomplicated tier rules that confuse customers, and loyalty features without measurement plans.
| Brand | Copy this | Watch out / tradeoff |
| Golds Gym | Automated winback and class reminders tied to last visit | Short term lifts; needs continuous tuning or benefits fade |
| Starbucks Rewards | Convenience + points to build habit | Can become a discount arms race if rewards are purely transactional |
| Sephora Beauty Insider | Tiered experiential perks and personalization | Requires data maturity to personalize without noise |
| Amazon Prime | Bundled services that raise switching cost | High fixed cost; only viable with scale and cross‑sell |
Key takeaway: small, measurable retention wins fund loyalty experiments. Use automation to create the floor (improve retention rates and CAC payback), then invest incremental margin into loyalty mechanics that build emotional value and advocacy.
Judgment: many teams chase loyalty program design before they can demonstrate reliable retention lift. That reverses the right sequence — prove you can move behavior with flows and offers, then scale the investment into a membership or experiential program. If your retention rates and LTV are unstable, prioritize automation and measurement first.
Next consideration: pick one case study element to test this quarter — a 14‑day SMS winback, a mobile convenience reward, or a tiered VIP pilot — and measure incremental LTV by cohort before expanding.
Prioritized 30 60 90 day action plan and recommended experiments
Direct point: Use the first 90 days to stabilize short-term revenue with retention automation, run high-signal experiments that separate behavioral lift from sentiment, and prepare the data foundation needed to justify a loyalty program. Do not treat 90 days as the window to prove long-term loyalty; it is a test-and-scale period for retention plus early loyalty signals.
Days 0-30 — audit, quick wins, and baseline dashboards
- Retention audit: Map the top three churn moments (post-purchase drop-off, 7–21 day inactivity, subscription cancel flow). Track cohorts by acquisition source and product SKU.
- Implement one winback flow: Deploy a 14-day winback SMS or email sequence for lapsed high-value customers. Use a single treatment vs control (10% of lapsed segment) to measure lift.
- Cohort dashboard: Build weekly cohort retention, 30-day revenue retention, and acquisition channel LTV. Make these visible to growth and CSRs.
- Minimum instrumentation: Ensure event-level signals exist for purchases, email opens, SMS replies, refunds, and cancellations so experiments are attributable.
Practical trade-off: Quick win flows drive immediate revenue but can hide quality issues. If winback lifts revenue but increases refunds or churn after reactivation, you fixed symptoms not product fit. Track post-reactivation churn for 60 days.
Days 31-60 — controlled experiments and early loyalty mechanics
- A/B test onboarding: Run a test that compares a single streamlined onboarding sequence versus a richer experience that includes a micro-incentive (10% off next order or small points). Measure 30-day repeat rate and average order value.
- Pilot a referral incentive: Launch a time-limited refer-a-friend with clear economics (credit that must be used within 45 days). Randomize to measure referral rate and incremental CAC.
- Micro loyalty mechanic: Try a simple tiered benefit (e.g., free shipping after 3 purchases) for a subset of customers — measure frequency change and share of wallet.
- Quality checks: Add a customer satisfaction NPS pulse 14–21 days after reactivation or first use to detect transactional vs emotional loyalty signals.
Limitation and judgment: Loyalty mechanics will dilute margin if designed poorly. Use temporary credits or experiential rewards initially rather than open-ended discounts. Points systems look attractive but require 6–12 month modeling to understand breakage and margin impact.
Days 61-90 — scale winners, design the loyalty roadmap
- Scale winning flows: Expand the winback and onboarding variants that show statistically significant lift and acceptable post-reactivation behavior.
- Design a loyalty roadmap: Convert the best-performing micro mechanic into a roadmap for a formal tier or points program. Include expected 6–12 month ROI and breakage assumptions.
- Controlled rollout for loyalty: Run a staggered rollout or holdout group to attribute long-term lift to the loyalty feature — avoid full rollout before 90 days of clean signals.
- Operationalize retention: Create playbooks for lifecycle-triggered messages and handoffs to customer success for high-value churn risk customers.
| Experiment | Primary metric | Success threshold (sample) |
| 14-day winback SMS | 7-day reactivation rate and 30-day revenue | +10% reactivation OR +5% 30-day revenue from targeted cohort |
| Onboarding A/B test (micro-incentive) | 30-day repeat purchase rate | +4 percentage points in repeat rate with neutral AOV |
| Referral pilot (credit) | Referral conversion rate; incremental CAC | ≥1.5x payback in first 90 days on referral-originated LTV |
| Micro loyalty tier (free shipping after 3 purchases) | Purchase frequency and share of wallet | +8% purchase frequency among enrolled users |
Benchmarks to monitor: Aim for a 5–15% immediate revenue lift on targeted retention flows, 3–6 percentage point improvement in 30-day retention for onboarding wins, and referral pilots that recover CAC within 90 days.
Concrete example: A DTC subscription apparel brand ran a 14-day winback SMS targeted at customers who missed two consecutive shipments. The control reactivation rate was 6%; the SMS treatment lifted it to 14% with neutral return rates. That immediate cash flow justified expanding the sequence and funding a small referral pilot.
What most teams get wrong: They treat loyalty as a one-off program launch. In practice, loyalty should be staged: prove behavioral lift through retention experiments first, then invest in emotional or experiential mechanics when you can model positive long-term ROI.
Start small, instrument everything, and set explicit stop/scale rules before you test. If an experiment meets the pre-defined success thresholds, scale; if not, reallocate budget within the 90-day window.
Next consideration: define the 6-month KPI set you will use to judge whether a loyalty program is warranted — not sentiment alone, but incremental LTV and margin after accounting for rewards and breakage.
Frequently Asked Questions
Straight answers for busy teams: below are operational FAQs you can act on this week when weighing customer retention vs loyalty efforts.
How do I decide which metric to prioritize this month?
Prioritize the metric tied to your immediate cash problem. If your short-term issue is revenue leakage, focus on cohort retention and 30-day repeat rates. If your problem is low referral volume or poor margin defense against discounting, prioritize NPS, referral rate, and share of wallet.
Can a loyalty program substitute for basic retention work?
No — loyalty programs rarely fix foundational retention issues. Loyalty rewards amplify customers who already have good product-market fit and smooth experience. If onboarding, fulfillment, or service quality are broken, points or tiers will mostly subsidize churned customers rather than create durable loyalty.
What trade-offs should I consider when launching a points program?
Trade-off: faster frequency versus margin dilution. Points accelerate repeat purchases but create future liability and can train customers to expect rewards. For thin-margin categories, prefer experiential perks (early access, exclusive content) over heavy discounts.
How should I test whether a retention flow or a loyalty pilot is delivering incremental value?
Run small randomized pilots and measure incremental LTV over a defined window. For retention flows use short windows (30 to 90 days) and measure lift in repeat rate and recovery revenue. For loyalty pilots measure behavior over longer windows (3 to 12 months) and track changes in share of wallet and referral lift.
Concrete Example: I worked with a mid-market subscription brand that had 35 percent 30-day churn. We launched a segmented onboarding drip and a triggered winback SMS. Within eight weeks the 30-day retention for the targeted cohort improved by about 12 percentage points; the later loyalty pilot increased average order value but only showed payback at month nine, underscoring how retention vs loyalty payback windows differ.
When should I survey for NPS versus relying on behavioral signals?
Use NPS for directional sentiment and qualitative signals, not as a short-term revenue lever. Run NPS quarterly and after major experience milestones like onboarding and support interactions. Combine NPS with behavioral cohorts so you can tie sentiment to actions — for example, compare churn among promoters versus passives after a support ticket.
What common mistakes slow progress on retention or loyalty?
Mistake one: measuring loyalty too early. Expect emotional loyalty and advocacy to build over many touchpoints. Mistake two: overcomplicating experiments. Start with one simple retention flow or a one-tier loyalty pilot and measure lift. Mistake three: neglecting attribution — without cohort tests you won’t know what really moved LTV.
Key takeaway: Run retention automation for immediate recovery and predictable lift; design loyalty investments when your unit economics and operational quality are stable enough to support a longer payback period.
Practical next steps you can take this week
- 30-day quick win: Audit your onboarding and implement one automatic winback SMS or email for customers who miss their second purchase.
- 60-day experiment: Launch a small A/B test comparing a points-based offer versus an experiential perk for your top 10 percent most valuable customers.
- 90-day measurement: Create a simple cohort report that contrasts behavior of experiment participants versus non-participants over 90 and 180 days; use randomized allocation where possible.
If you have to choose one place to spend limited energy, fix the customer journey first. Rewards work only when customers actually experience reliable service and value.
Ready to Run Successful Marketing Campaigns and Grow Your Business?
Gleantap helps you unify customer data, track behavior patterns, and automate personalized campaigns, so you can increase repeat purchases and grow your business.
Ready to Run Successful Marketing Campaigns and Grow Your Business?
Gleantap helps you unify customer data, track behavior patterns, and automate personalized campaigns, so you can increase repeat purchases and grow your business.