 Divya Ghughatyal
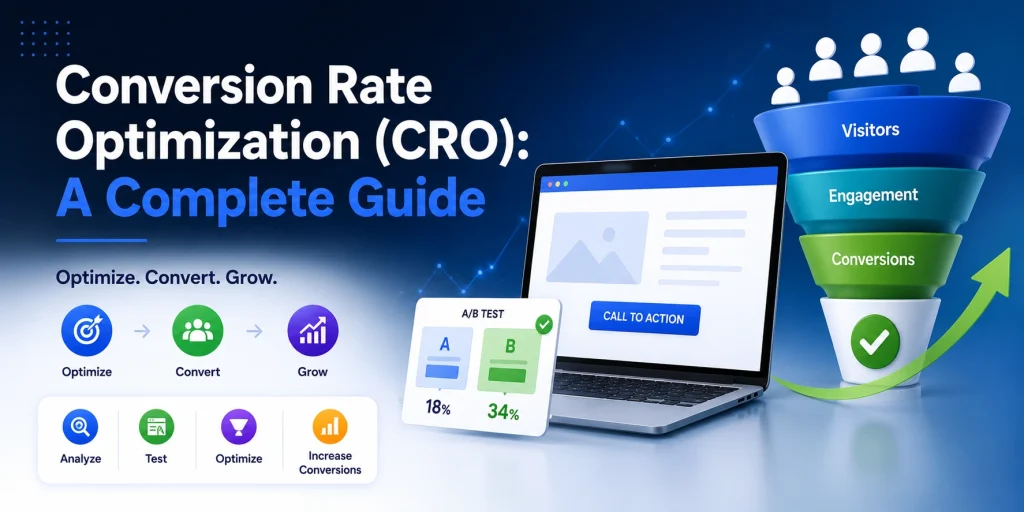
If your website traffic is healthy but memberships are lagging, conversion rate optimization is the lever that boosts revenue without raising ad spend. This guide lays out practical use cases and step-by-step conversion rate strategies to fix leaks across the sales pipeline, covering research, prioritization, A/B testing, personalization, and automation, while showing how to improve conversions through proven strategies, tools, and real examples. You will get templates, a prioritization scorecard, and a 30/60/90 day playbook a small team can start using this month.
Why conversion rate optimization matters for the sales pipeline and revenue
Key point: Conversion rate optimization is valuable only when you translate percent lifts into real pipeline and revenue outcomes. Small relative lifts mean nothing if they do not move more qualified leads into paid membership or reduce customer acquisition cost.
Translate CRO lifts into dollars and pipeline stages
Concrete example: Start with 10,000 monthly sessions, baseline conversion rate 2 percent, and membership price $50 per month. Moving to 3 percent converts an extra 100 leads per month (10,000 0.01 = 100). If 30 percent of those convert to paid and stay 8 months on average, annualized revenue impact is meaningful: 100 extra leads 0.30 $50 8 = $12,000. That is a simple, conservative calculation that shows a one percentage point lift can pay for months of marketing or staffing.
Micro versus macro conversions: Map every test to a pipeline phase. Micro conversions include landing form fills, class bookings, and trial activation. Macro conversions are first paid visit, membership purchase, and reactivation. Improving a micro conversion without tying it to trial-to-paid conversion risks inflating lead counts without revenue.
- Awareness to lead: landing page visit to form submission – moves prospects into CRM.
- Lead to activation: trial signup to first attended session – critical for trial velocity.
- Activation to paid: trial to membership purchase – the most direct revenue lever.
- Retention: reducing churn multiplies the value of every new member.
Practical insight and tradeoff: Prioritize tests that affect later funnel stages when you can measure revenue impact quickly. Early funnel wins are tempting because they are easy, but they can increase unqualified leads and raise operating costs if class capacity or sales follow up is not adjusted.
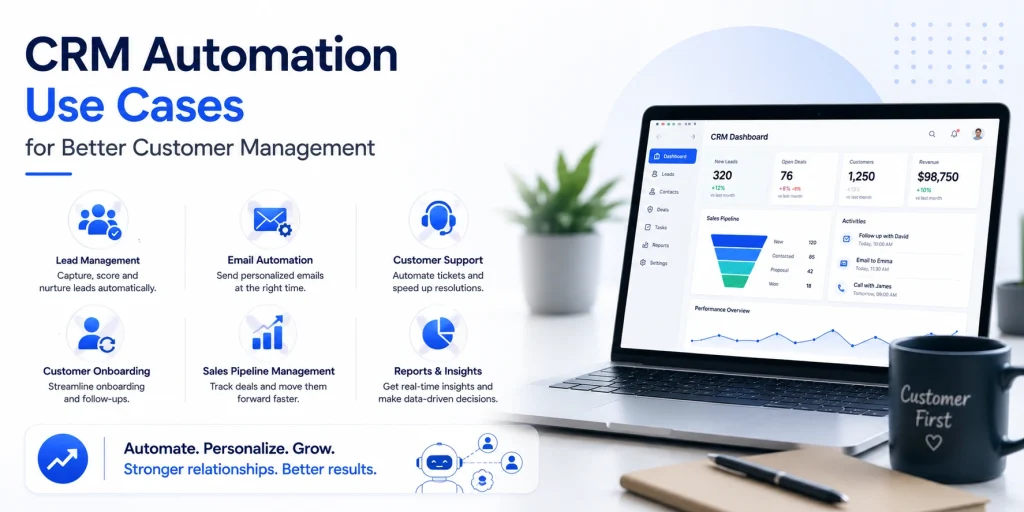
Gleantap use case: For a gym that runs paid ads, improving trial-to-paid conversion by 10 percent lowered CAC by roughly the same proportion while increasing lifetime value. In practice this meant fewer wasted leads for the sales team and allowed marketing to scale spend profitably. Use automation to turn a trial sign up into a timed SMS sequence that boosts first paid visit rates within the trial window; measure lift with a holdout group to prove incremental revenue.
Common misjudgment: Teams celebrate conversion rate percent change without checking capacity and LTV. A 25 percent lift on a vanity metric like add to cart or form opens the door to more work downstream. Ask what changes in staffing, class spots, or retention processes must happen if the test succeeds.
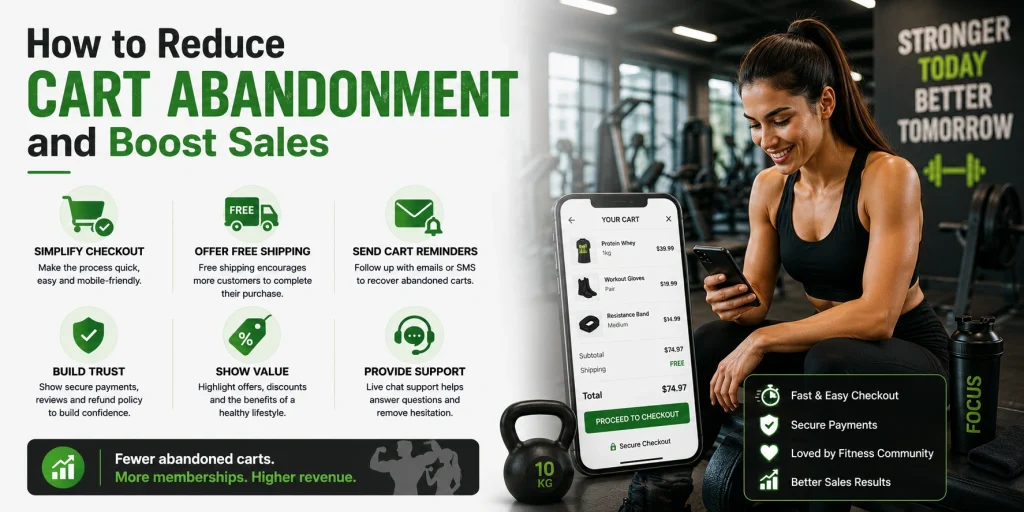
Benchmarks to watch: Baymard Institute shows checkout friction causes large abandonment on transactional flows – use that as a reminder that checkout and payment friction translate directly to lost revenue. See Baymard checkout research for details.
Measurement judgment: Always convert conversion lifts into at least two business metrics before deciding to scale: incremental revenue per month and change in CAC. If a change raises conversion but increases churn or lowers average order value, it is not a win. Use short revenue calculators like the example above to make decisions fast.
Next consideration: After you map lift to revenue, pick one pipeline stage where a test will directly affect paid membership and design the experiment and measurement around that revenue outcome.
Define conversion events and metrics to track across funnel stages
Start small and map to dollars. Pick a concise set of high signal events that correspond to real pipeline steps – not every click, modal open, or hover. Each event you track must answer one question: does this move a lead closer to a paid membership or reduce churn
Core events by funnel stage
| Funnel stage | Representative events | Primary metric to watch | Guardrail metrics |
| Awareness | Ad click, landing page view | Landing conversion rate (visits to lead) | Bounce rate, traffic quality by source |
| Lead capture | Form submission, phone call, chat start | Lead conversion rate (visits to lead captures) | False positive leads, lead completeness |
| Activation | Trial signup, class booking, first trial check in | Trial activation rate (leads to activated trials) | Time to first visit, no show rate |
| Commitment | Membership purchase, subscription start | Lead to paid conversion rate | Average order value, payment failure rate |
| Retention | Recurring visit, renewal, reactivation after churn | Retention rate, churn rate | Net promoter score, support tickets |
Key formulas and velocity matters. Conversion rate equals conversions divided by eligible visitors. But conversion velocity – how fast a lead moves from one event to the next – often matters more to cash flow and CAC than the static rate. Track both percent and median time between events
- Prioritize high signal events: focus on events that are verifiable and revenue linked such as payment successful or first paid visit rather than soft signals like page scroll
- Use guardrails to catch gaming: monitor false positive leads, form stuffing, or incentivized signups that inflate conversion rate while destroying lead quality
- Set attribution windows per event: trial to paid should use a 30 60 90 day window depending on your sales cadence so you capture delayed conversions
Practical tradeoff. Capturing every micro interaction gives more data but raises noise and analytic cost. Prefer a compact event schema – typically 6 to 8 events for local fitness businesses – then instrument deeper only where a hypothesis requires it
Important – instrument events with consistent naming and properties so you can segment by traffic source, device, and campaign without rebuilding tracking later
Concrete example: A neighborhood gym tracked three events – form submit, trial check in, membership purchase. After adding time to first visit as a metric they discovered many trial signups never checked in. They introduced same day SMS reminders using content=null&utmsource=null&utmcampaign=null&utmmedium=null target=_blank>Why Gym and Fitness Centers Should Use Text Message Marketing and measured a 25 percent rise in trial activation rate while lead quality held steady
Implementation note. Use Google Analytics 4 funnels for stage conversion rates and a session replay tool to validate event semantics before relying on numbers. Bad event definitions are the most common source of misleading conversion rate improvements
Rule of thumb – start with events that map to revenue impact, track conversion rate and conversion velocity for each stage, and add one guardrail metric per stage to prevent false positives
Next consideration – document the event definitions, ownership, and attribution windows and run a two week data quality sprint before using the metrics to prioritize tests
Research phase: how to discover the highest impact opportunities
Direct point: The highest impact CRO opportunities rarely come from intuition or surface metrics alone. Combine funnel-level quantitative signals with targeted qualitative evidence to find friction that actually moves revenue through your sales pipeline.
What to capture during a two week research sprint
- Funnel snapshot: capture conversion rates for each stage by source and device (awareness to lead, lead to trial activation, trial to paid). Use GA4 funnels and export the numbers so you can model revenue impact quickly. See Google Analytics measurement for funnels.
- Top dropoff pages: rank pages by absolute lost conversions, not percent. A 10 percentage point drop on a low traffic page is lower priority than a 2 point drop on your main landing page.
- Session recordings and heatmaps: record sessions specifically for users who drop out at the highest value step. Look for repeated behavior patterns: hidden fields, misaligned CTAs, unexpected popups. Tools include Hotjar or FullStory; the method is described in CXL conversion research.
- Onsite intent surveys: deploy one question to users who abandon the form asking what stopped them. Keep it short and classify responses into friction, price, schedule, or other.
- Sales and CRM signals: pull CRM notes or call recordings for leads that failed to convert. Often reps flag recurring objections that site data will not show.
- Performance and technical checks: measure load times and mobile rendering for the pages with highest dropoff. Slow LCP or unstable layout is a silent conversion killer.
- Segmented behavior: compare new versus returning users, paid traffic versus organic, and mobile versus desktop. Small wins on a high quality segment are worth prioritized tests.
Practical insight and tradeoff: If your site gets under ~1,500 sessions per week, A/B testing is usually low velocity and expensive. In practice, deploy qualitative fixes and targeted personalization first, then use holdout tests to measure incremental lift. For higher traffic sites prioritize randomized A/B tests.
| Evidence | Where to find it | What to record |
| Where users drop off in funnel | GA4 funnel or Mixpanel cohorts | Step name, baseline conversion rate, sample size for 14 days |
| Why users drop off | Session recordings and survey snippets | 2-3 representative recordings and top 5 survey responses |
| Sales objections | CRM notes or call recordings | Top 3 repeated objections with frequency |
Concrete example: A local gym noticed mobile form submissions were 60 percent lower than desktop. GA4 showed the dropoff step, and session replays revealed the virtual keyboard covered the submit button on certain Android devices. Removing an optional field and moving the CTA above the fold increased mobile signups by 25 percent within two weeks. The team then used content=null&utmsource=null&utmcampaign=null&utmmedium=null target=_blank>Gleantap to trigger an SMS for partial form abandons while the site fix rolled out.
Judgment that matters: Stop collecting data for its own sake. Prioritize evidence that ties directly to revenue moments in the sales pipeline. If a metric change cannot be mapped to additional paid memberships or a lower CAC within your model, deprioritize it until you have a clear revenue linkage.
Key takeaway: Run a focused two week sprint that pairs GA4 funnel numbers with 20 targeted session recordings, one short onsite survey, and CRM objections. Use that evidence to write 3 testable hypotheses that map to pipeline revenue before you design experiments.
Next consideration: After research, convert the strongest evidence into ranked hypotheses using a prioritization framework and estimate revenue impact before you test.
Ready to Run Successful Marketing Campaigns and Grow Your Business?
Gleantap helps you unify customer data, track behavior patterns, and automate personalized campaigns, so you can increase repeat purchases and grow your business.
Ready to Run Successful Marketing Campaigns and Grow Your Business?
Gleantap helps you unify customer data, track behavior patterns, and automate personalized campaigns, so you can increase repeat purchases and grow your business.