
If your retention playbook defaults to blanket discounts, you erode margins and still miss the customers who are quietly slipping away. This guide shows how CRM customer retention automation can detect at-risk customers using concrete signals, a transparent scoring recipe, and targeted multi-channel playbooks that favor value nudges and service recovery over constant promotions. See the section Customer Retention Automation: Keeping Customers Without Constant Promotions for practical tactics, a 30-60-90 rollout, and a measurement plan you can run with a control group.
1. Business case and KPIs for identifying at-risk customers
Immediate point: identifying who is slipping now preserves margin far more effectively than chasing replacements later. CRM customer retention work is high-leverage because small relative gains compound across existing revenue streams; use the retention lift to protect gross margins rather than fund permanent discounts.
Key constraint: you cannot measure everything at once. Pick a small set of KPIs that map directly to revenue or cost and run a controlled pilot. Too many metrics spread attention and hide the causal signal you need to prove ROI.
Priority KPIs and why they matter
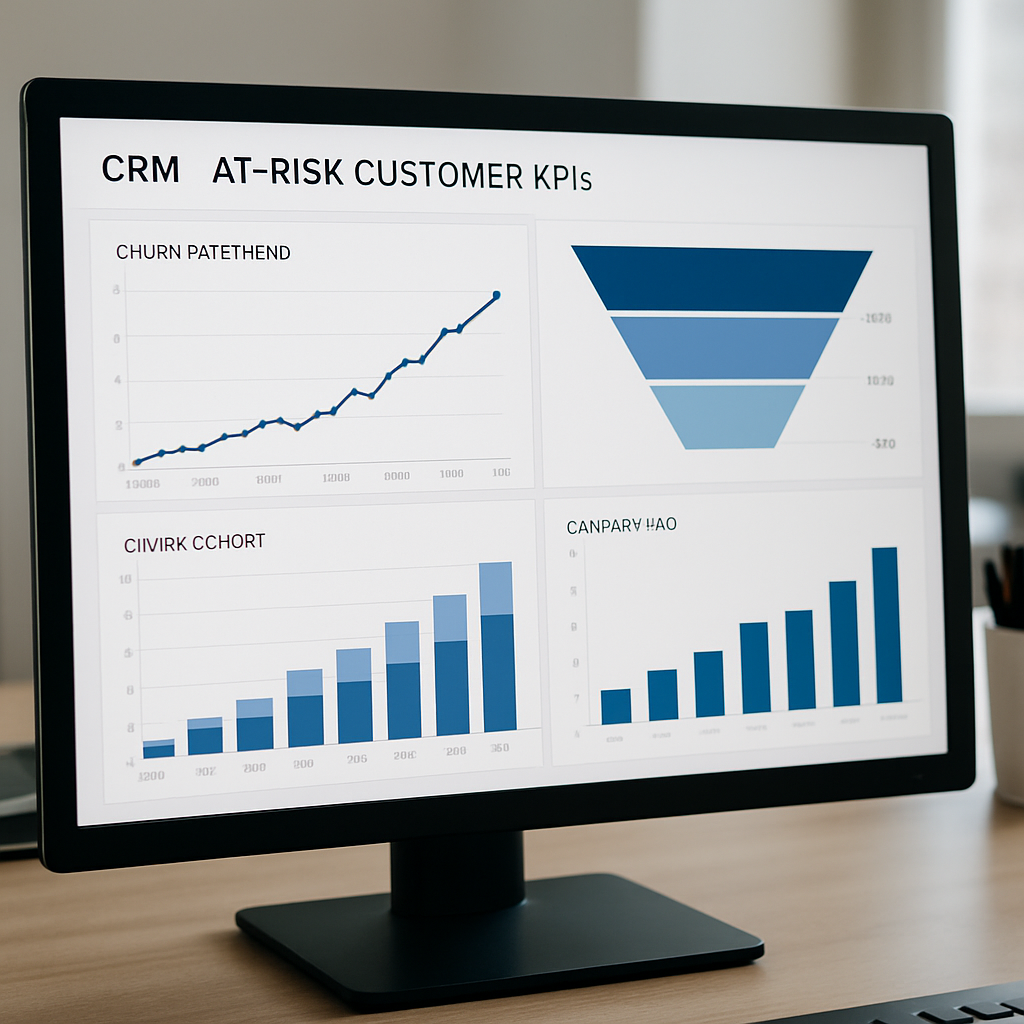
Below are the practical KPIs retention teams should track from day one. Each one answers a narrow operational question—who to contact, whether the contact worked, and whether the dollar impact justifies the intervention.
| KPI | Business impact | Measurement cadence |
| Monthly churn rate | Directly affects recurring revenue and acquisition payback; primary signal for long-term health | Weekly trend + monthly cohort |
| 30/60/90-day reactivation rate | Shows short-term success of re-engagement playbooks and lift from specific automations | Daily for campaigns; rolling 30/60/90 cohort update |
| Customer lifetime value (CLV) | Guides how much you can spend to recover a customer without eroding margin | Monthly recalculation; use cohort-level LTV for pilots |
| Cost to retain (per reactivated customer) | Immediate ROI check: campaign cost vs incremental revenue | Per campaign; roll up monthly |
| Net revenue retention (NRR) | Captures expansion/contraction effect after interventions | Quarterly, with monthly monitoring for anomalies |
Pilot targets that are realistic: aim for a 10–20 percent relative reduction in the pilot segment’s monthly churn or a 15–25 percent increase in 30-day reactivation versus control. Those ranges typically produce measurable revenue lift inside 60 to 90 days without aggressive discounts.
Trade-off to accept: optimizing for near-term reactivation often favors tactile channels like SMS and low-friction offers, which can inflate short-term reactivation but depress CLV if overused. Track both reactivation and downstream revenue to spot this early.
Concrete example: a boutique fitness studio with an 8 percent monthly churn baseline runs a 60-day pilot targeting members whose last class was 14+ days ago. The pilot aims for a 20 percent relative churn reduction in the test group versus a randomized holdout; if achieved, that translates to an immediate increase in monthly recurring revenue and lowers new acquisition needed to replace lost members.
Note: small retention improvements scale. Research shows a 5 percent increase in retention can boost profits substantially—see Harvard Business Review for the classic analysis. Use that as a sanity check when calculating campaign ROI.
Measurement practicality: ensure minimum sample sizes before running tests—segments under a few hundred customers will produce noisy outcomes. Run pilots with clear control groups and plan for a 60–90 day observation window to capture behavior cycles.
Focus KPIs on revenue linkage and actionability: churn, short-term reactivation, CLV, cost to retain, and NRR. Prove lift with randomized holdouts before scaling.
2. Signals and events that indicate a customer is at risk
Clear reality: no single metric reliably flags a slipping customer. The practical approach is to combine behavioral, transactional, engagement, sentiment, and product-usage events into a compact set of signals you can operationalize in your CRM customer retention systems.
- Behavioral: declining visit frequency or long gap since last interaction (events: classattended, visitlogged, app_opened).
- Transactional: failed payments, paused subscriptions, or refund requests (events: paymentfailed, subscriptionpaused, refund_initiated).
- Engagement: falling open/click rates and stopped replies (events/traits: emailopen, smsclicked, lastmessageresponse_at).
- Sentiment & support: negative NPS or increasing support severity (events: npssubmitted, supportticketcreated, supportescalated).
- Product usage: reduced feature use, abandoned carts, or fewer bookings per typical cycle (events: productview, addtocart, bookingcancelled).
Design considerations and lookbacks
Each signal needs a lookback window and a noise-control rule. Short windows (7–30 days) surface fast-changing issues like payment failures but are noisy. Long windows (90+ days) capture slow decay and seasonality but delay action. For most B2C pilots, start with three-month baselines for behavioral norms, then add a 30-day window for immediate triggers like payment failures or no-shows.
Practical trade-off: aggressive thresholds find more at-risk customers but increase false positives and outreach volume. Prioritize signals where the cost to contact is low (SMS, light-touch email) and reserve human follow-up for high-value segments.
Pseudo-SQL examples: detect two common signals using event tables and profile traits. `– Last activity > 21 days
SELECT profileid FROM profiles WHERE profiles.lastactivityat < currentdate – interval 21 days;
— Any recent payment failure
SELECT DISTINCT profileid FROM events WHERE eventname = paymentfailed AND occurredat > current_date – interval 30 days;`
| Signal | Gleantap event / trait | Trigger condition (example) |
| Recency decay | profiles.lastactivityat / event.app_opened | no appopened or classattended in 21–45 days |
| Payment friction | event.paymentfailed / profiles.paymentfailure_count | paymentfailed >= 1 in last 30 days or paymentfailure_count > 0 |
| Engagement drop | emailopen / smsclicked / profiles.lastmessageresponse_at | email open rate down 50% vs prior 30-day window |
Concrete example: a retail brand notices a segment of repeat buyers with a drop in view-to-cart rate and zero purchases for 60 days. The CRM flags these profiles when product_view frequency falls 60 percent versus their prior 90-day baseline and triggers a browse-abandonment workflow that emphasizes replenishment and personalized recommendations rather than blanket discounts.
What teams miss in practice: many teams track only obvious signals like last purchase date and then drown in contact lists. In reality, the highest-lift signals combine categories: a recent payment failure plus declining open rates is much more actionable than either alone. Build simple composite rules first and treat predictive models as the second step.
Minimum data requirement: keep at least three months of consistent event and transaction history for baseline behavior; extend to six months when seasonality or infrequent purchases matter. Ensure identity resolution so events map to the right profile before you automate outreach.
Map each signal to a low-cost response type and a follow-up SLA. Cheap, fast touches for noisy signals; human intervention reserved for high-value or multi-signal flags.
3. Constructing an at-risk score that teams can operationalize
Direct instruction: build an at-risk score that operations can read, act on, and tune without calling data science every time. Prioritize a transparent, weighted rule-based score first, then graduate to a predictive model once you have reliable labels and volume.
A compact, interpretable scoring recipe
Score structure: create five component buckets with simple numeric points and sum them to a 0–100 scale: Recency (0-30), Frequency change (0-25), Payment friction (0-25), Engagement decay (0-15), Support/sentiment flags (0-5). Each component maps to one or two CRM events such as lastactivityat, purchases90d, paymentfailed, emailopenrate, and supportticketseverity.
- Step 1 — Define component rules: pick thresholds that match your business cadence. Example: for Recency, 0 points if last interaction within 14 days, 15 points if 15-30 days, 30 points if >30 days.
- Step 2 — Weight by cost to contact: give higher weight to signals that justify a human touch or immediate channel spend; lower weight to noisy, cheap-to-contact signals.
- Step 3 — Bucket for action: translate the numeric total into Low, Medium, High risk bands with explicit next actions for each band and contact quotas per week.
- Step 4 — Operationalize fields: store score and component breakdown as profile traits in your CRM so playbooks can reference atriskscore and atriskcomponents directly.
- Step 5 — Make it tunable: expose three knobs to operators: recency sensitivity, payment weight, and engagement decay multiplier.
Calibration and trade-offs: interpretability costs a bit of accuracy but pays back in speed. Rule-based scores let retention managers understand why someone was contacted and adjust weights to control volume. Predictive models often perform better but require 5k+ labeled profiles, ongoing monitoring for drift, and a plan for human review when the model surface surprises.
Validation steps that matter: backtest the score against historical cohorts, measure precision at each risk band, and set an acceptable false positive ceiling for low-touch channels. For pilots, use at least several hundred profiles per test cell for behavioral signals and thousands for model training when possible.
Concrete example: a wellness studio assigns 30 points when lastbookingat > 30 days, 20 points when booking rate drops 50% vs prior 90 days, and 25 points for a payment failure within 15 days. A customer scoring 75 triggers a 3-step reactivation sequence with SMS first, email follow-up, and a concierge call for VIPs. The studio measures 30-day reactivation versus a randomized holdout to validate lift.
Key consideration: do not treat the score as a verdict. Use it to prioritize outreach and surface root causes. Poor customer experience compounds revenue loss; businesses lose large sums from avoidable friction — see newvoicemedia research.
Common misjudgment: teams often tune thresholds to maximize short-term reactivation without checking downstream revenue impact. Tie each risk band to a cost-to-contact cap and monitor CLV after reactivation so the score does not become an excuse for margin eating campaigns.

4. Automation playbooks to surface and engage at-risk customers
Practical point: playbooks translate an at-risk signal into a repeatable sequence that minimizes manual triage and targets the right channel at the right time. Your goal is to move customers back toward habitual usage with incremental value nudges first, then escalate to friction removal and human help only when needed.
Six playbooks to implement now
- Soft nudge (low friction): Trigger: recency breach (e.g., last activity window triggered). Sequence: SMS → lightweight email 48 hours later. Message intent: remind and reduce hesitation (class or product highlight). Typical uplift: vendor benchmarks report single to low double-digit reactivations for careful, targeted nudges.
- Product value highlight: Trigger: usage decline plus moderate score. Sequence: email with personalized usage summary → push for app users. Message intent: show achieved benefits or unused features to remind of value.
- Education drip (medium): Trigger: multi-signal engagement decay. Sequence: 3-email mini-series over 10 days. Message intent: remove confusion (how-to, tips, short tutorials) rather than sell.
- Friction removal (high intent): Trigger: payment failure or repeated booking cancellation. Sequence: immediate SMS with retry link → email with one-click reschedule → human follow-up if unresolved. Message intent: solve the obstacle preventing continued use.
- Social proof / community nudge: Trigger: low activity combined with positive NPS or friends-in-network. Sequence: push or email with member stories and invite to a small event. Message intent: restore belonging and routine.
- Reactivation offer (last resort): Trigger: high risk + no response to prior flows. Sequence: time-limited incentive (use sparingly) + concierge call for VIPs. Message intent: behavioral nudge with controlled cost; reserve for segments where CLV justifies the expense.
Sequencing rules and throttles: Prefer immediacy for urgent signals (payment issues or known booking windows) and a gentler cadence for behavioral decline. Use 12–48 hours between an SMS and follow-up email for fast issues, and 48–96 hours before routing to a human. Always enforce channel frequency caps per profile and honor do-not-contact flags.
Trade-off to manage: aggressive automation catches more at-risk customers but increases contact volume and complaint risk. The practical compromise is tiered escalation: low-touch for broad segments, human outreach only for high-value or multi-signal profiles. Plan SLA and staffing before you scale so automation does not create an operational backlog.
Concrete example: boutique fitness studio workflow
Concrete example: A studio flags members with an at-risk score >= 70 after missing two classes in 21 days and a recent drop in app opens. The automation sends an SMS within 12 hours offering a simple booking link, an email 48 hours later with a short habit-building tip, and if still inactive after 7 days, schedules a concierge call for top-tier members. Success metric: 30-day rebooking rate versus a randomized holdout.
Important: attach a small control group to any new playbook so you can measure true incremental lift. Link the test back to revenue metrics and avoid scaling flows that only increase short-term activity without improving long-term value.
5. Customer Retention Automation: Keeping Customers Without Constant Promotions
Direct point: persistent discounting trains customers to wait for offers and destroys margins. CRM customer retention that works without continuous promotions focuses on increasing perceived product value, removing friction, and nudging habitual behavior through timely, personalized signals.
Practical tactics to replace blanket discounts
- Usage nudges: Send targeted reminders and micro-habits that align with a customers expected cadence – for example habit streak summaries, short challenges, or class waitlist notifications. KPI to watch: change in active days per month for the contacted cohort.
- Problem resolution flows: Automate immediate payment retry options, one-click rescheduling, and a clear path to human help when needed. Metric to watch: resolution rate within 48 hours and subsequent retention after resolution.
- Personalized value content: Replace generic promotional copy with tailored content that highlights what a customer has not used or achieved – progress summaries, product replenishment reminders, or feature tips. Measure open to action conversion rather than opens alone.
- Recognition and perks that are not discounts: Use tiered early access, complimentary add-ons, or community invitations that reinforce status rather than reducing price. Track engagement with exclusive events and membership tier movement.
- Community and social hooks: Activate small local events, referral meetups, or member showcases that restore routine through belonging. Monitor attendance lift and peer-driven rebookings as retention signals.
Trade-off to plan for: These approaches require better data and slightly more engineering than firing discounts. Personalization and friction removal need accurate identity resolution and event hygiene. If those foundations are weak, targeted offers may still be cheaper in the short run, but they cost margin and erode long term CLV.
Implementation consideration: Start by instrumenting low-friction nudges and payment-retry links in your CRM software, then add personalized content once you have consistent event mapping for most active customers. Reserve loyalty perks and human outreach for higher lifetime value segments to control costs.
Concrete example: A regional family entertainment center replaced a running discount program by sending automated birthday reminders with group bundle suggestions and an easy online booking link. The sequence included a single SMS reminder 7 days before the birthday and an email with party planning tips; staff follow-up was triggered only for packages over a threshold. The center reported fewer discount redemptions and higher average spend per visit for reopened accounts.
Judgment: Do not treat personalization as optional. In practice, teams that try to avoid discounts but keep sending generic messages fail faster than those that invest in modest profile enrichment. A small set of accurate traits tied to event signals unlocks most non-discount interventions.
Next consideration: instrument measurement from day one – cost per retained customer, resolution-to-retention lag, and cohort CLV after reactivation will show whether non-discount tactics actually preserve margin.
6. Measuring impact and proving lift
Hard requirement: treat measurement as part of the automation, not an afterthought. If you cannot show incremental reactivation and incremental revenue from an at-risk workflow, you are guessing whether the program preserves margin or simply shifts spend.
Design the experiment before you build the playbook
Core elements: pick a randomized holdout or a staggered rollout, define a single primary KPI, and lock the test window before you touch messaging. Don’t swap test cells mid-run. Random assignment avoids selection bias; staged rollouts are useful when operations cannot support simultaneous live traffic.
- Primary KPI: choose one of reactivation rate, incremental revenue per profile, or reduction in churn rate over the target period.
- Test length: run long enough to capture the customer’s normal behavior cycle—for low-frequency purchasers use a 90-day observation window; for weekly cadence businesses a 30–45 day window can be defensible.
- Segmentation: restrict the experiment to a homogeneous segment (same LTV band and behavior pattern) to reduce noise.
Attribution and ROI — simple math you must do
Practical calculation: measure the difference between test and control outcomes and translate that into dollars. Use conservative assumptions for retained revenue and attrition after reactivation to avoid overstating impact.
Example calculation: A retail subscription pilot: 2,000 customers in test, 2,000 in control. After 60 days, 180 test customers reactivated (9.0 percent) vs 110 control customers (5.5 percent). Incremental reactivations = 70. If average first-month revenue per reactivated customer is $45, incremental revenue = 70 * $45 = $3,150. Campaign cost (creative + sends + staff) = $700. Net incremental revenue = $2,450. Payback period is immediate; ROI = 3.5x. Run sensitivity checks: if only 60 of the incremental reactivations were retained into month 2, adjust LTV assumptions before scaling.
Trade-off to accept: the tighter your control logic and the smaller your test cohort, the longer you need to run to reach statistical clarity. If sample sizes are limited, focus on revenue per contact rather than percent-lift and run multiple sequential pilots rather than one noisy large test.
Dashboards and analyses that prove causality
Build a small set of visuals that answer precise questions: did the flow increase rebooking, did it change spend, and did it reduce cancellation events? Use three charts: a reactivation funnel (contacts → clicks → rebookings), rolling cohort retention (30/60/90 day comparisons between test and control), and a revenue waterfall that isolates incremental dollars attributable to the flow.
Operational warning: attach monitoring for negative signals—complaint rate, unsubscribe rate, and short-term CLV decline. A flow that raises rebookings but also raises complaints or reduces month-3 retention is damaging; stop and re-evaluate before scaling.
Concrete example: A boutique fitness studio ran a 90-day randomized test of a friction-removal flow for members with a recent payment failure. The test increased 30-day reactivation by 6 percentage points versus control and recovered twice the average lost monthly revenue for each resolved account. Because the studio had pre-mapped SLAs, human follow-up capacity matched expected volume and complaint rates stayed flat.
Judgment: randomized holdouts are the gold standard. If operational constraints force a non-random rollout, accept a larger margin of uncertainty and run supporting analyses (pre/post trends, synthetic controls). Measure both short-term lift and downstream CLV to ensure you are not trading short-term gains for long-term margin loss.
Next consideration: before you scale, confirm your sample sizes and run a quick sensitivity analysis on LTV assumptions. Measurement that overstates lift will cost far more than delaying a rollout for robust validation.
7. Implementation plan and 30-60-90 day checklist
Direct action: treat the first 90 days as a delivery sprint with three concrete milestones: instrument reliable signals, prove a single automated pilot with a control, then scale the flows that show positive ROI. Keep the scope narrow so the team can ship and measure without burning bandwidth on broad personalization or multiple hypotheses at once.
Phase goals and quick constraints
30-day goal: validate event hygiene and deploy a transparent at-risk score that the operations team can read. 60-day goal: run a randomized pilot for one segment and measure incremental reactivation. 90-day goal: scale the winning playbook to adjacent cohorts with KPI gates. Constraint: staffing and data quality usually limit simultaneous pilots—choose one vertical or LTV band.
- Days 0–30: Foundation and signals (Owner: Product/Analytics) — Audit event consistency, finalize identity stitching rules, and map the minimum traits to profiles (lastactivityat, paymentfailurecount, messageresponseat). Acceptance: 90% of active customers have complete profiles for those traits; event latency < 6 hours.
- Days 15–30: Score and playbook design (Owner: CRM/Growth) — Build the weighted rule-based at-risk score and one low-touch playbook (soft nudge + value reminder). Acceptance: score stored as atriskscore on profiles; playbook ready in automation tool with test messages approved.
- Days 30–60: Pilot build and controls (Owner: CRM / Analytics / Ops) — Randomize a test vs holdout, enable throttles and unsubscribe handling, run the pilot on a single homogeneous segment. Acceptance: pilot live with control flagged, monitoring dashboards in place, and support SLA mapped for expected volume.
- Days 45–75: Observe and iterate (Owner: Analytics / CRM) — Monitor primary KPI daily, check complaint/unsubscribe rates, and tweak thresholds if contact volume exceeds capacity. Acceptance: preliminary lift estimate and signal quality report submitted at day 60.
- Days 60–90: Scale decision and operationalize (Owner: Head of Retention / Ops) — Approve scale based on ROI gates, add human escalation for VIPs, and extend the playbook to another segment if it passes. Acceptance: scale runbook, staffing adjustments, and fiscal gate (minimum ROI) defined.
Operational items to add directly to your project board: legal opt-in verification, integration tasks for POS/booking/payment, sample message approvals with brand/compliance, configuration of throttles and DNC handling, and an SLA for concierge follow-up when human outreach is triggered.
Practical trade-off: moving faster increases the chance you scale a noisy signal; moving slower reduces business risk but delays savings. In practice prioritize low-cost channels and conservative cadence for broad cohorts, and reserve human outreach or incentives for higher-value segments where the cost-to-contact is justified.
Concrete example: a neighborhood dental chain used this plan to reduce no-shows. By day 30 they had lastappointmentat and appointmentremindersent synced; by day 60 they ran a randomized SMS reminder plus one-click reschedule pilot for patients overdue 45+ days; by day 90 the clinic scaled the flow to all clinics after confirming the control group showed a 4 percentage point incremental rebooking lift and manageable staff follow-up load.
Run every pilot with a holdout and a fiscal gate. Tie the go/no-go decision to net incremental revenue per reactivated customer, not just rebooking percentage.
Key implementation constraint: if identity resolution or event latency is poor, automation will misfire and create bad experiences. Fix mapping and delay automation until the profile hit-rate meets your acceptance criteria; temporary manual triage is preferable to noisy mass outreach.
8. Example scenario using Gleantap for a boutique fitness studio
Quick claim: a compact Gleantap automation can identify slipping members, fix the most common frictions, and return them to habit without resorting to permanent discounts. This blueprint is intentionally prescriptive so a studio manager can map tasks to staff and calendar slots immediately.
Profile, signals, and the at-risk trigger
Customer profile example: a recurring member with a 6–8 visit monthly cadence, paid membership, and mobile app installed. Relevant Gleantap events to stream: events.bookingmade, events.bookingattended, events.bookingcancelled, events.paymentretry, events.smsresponse. Useful profile traits to create: traits.lastbookingat, traits.avgweeklyvisits, traits.membershiptier, and traits.atriskscore.
Trigger logic (operational): mark a profile as at-risk when the member misses three scheduled classes within a 28-day window and their one-month engagement metric falls below their personal baseline. Store the reason code (for example missedbookings + engagementdrop) so playbooks can tailor the message intent.
Automation workflow — concrete playbook
Playbook summary: once traits.atriskscore exceeds the threshold, run an automated sequence that prioritizes value and friction removal before any incentive. Channels are sequenced to escalate only if earlier steps fail.
- Step 1 (immediate): send an SMS with a one-tap rebook link and a short benefit reminder within 8 hours of the trigger.
- Step 2 (follow-up): send a personalized email 36 hours later with a 2-minute habit tip and suggested classes that fit prior behavior.
- Step 3 (app users): push a reminder five days after trigger showing a tailor-made 7-day plan; include social proof from similar members.
- Step 4 (escalation for high-value members): schedule a concierge call after ten days if still inactive; include a human note that confirms payment status and availability.
Why this ordering: immediate SMS addresses friction and choice inertia; email supplies richer context; push reaches engaged app users; human outreach is expensive and reserved for members with higher lifetime value. This tiered approach preserves margin while maximizing operational efficiency.
Pilot assumptions (conservative): run the pilot on a cohort of roughly twelve hundred members for a 42-day window. Use a randomized holdout to measure incremental rebookings versus control. Budget for campaign sends and two hours per day of concierge capacity during the pilot.
Expected outcomes and ROI thinking: in a conservative scenario expect a noticeable uplift in short-term rebookings and recovered revenue that exceeds campaign cost if reactivation is measured over the 42-day horizon. Translate results into incremental monthly revenue per recovered member and require a minimum payback multiple before approving any incentive-heavy scale-up.
Technical notes for Gleantap implementation: push the listed events to Gleantap in near real-time (max latency a few hours), create traits.atriskscore with component breakdowns, and use the platform Journey templates such as the Rebook Sequence and Payment Recovery flows. Wire traits.concierge_flag to route high-value profiles into the operations queue and enable throttles/DNC handling in the workflow settings. See Gleantap product for template names and sample journeys.
Practical limitation: false positives will occur if your booking data or identity stitching is incomplete. If you cannot hit a high profile coverage rate, reduce the pilot scope to members with consistent event history and one clear payment method on file. Staffing mismatch is the most common operational failure — automations must respect human capacity or they create poor experiences.
Judgment: start rule-based and short-cycle the test. Use the pilot to label outcomes and then train a predictive model only when you have reliable labels and volume.
Frequently Asked Questions
Practical point: an FAQ in your retention playbook is not a help doc — it is an operational guardrail. Use it to stop costly mistakes (over-contacting, misrouted incentives, or automation that overwhelms operations) before they happen.
Short answers CRM teams can act on
How much history do I need to detect at-risk customers? Aim for at least a few months that capture a full behavioral cycle for your product. If purchases or visits are seasonal or infrequent, expand that window until the baseline reflects normal peaks and troughs; otherwise your triggers will mistake seasonality for churn.
Won’t more outreach annoy customers and increase churn? It will if you treat everyone the same. Throttle by risk tier, respect do-not-contact flags, and make each touch clearly useful (payment retry link, reschedule option, or a personalized usage note). Cheap channels and high false-positive rates are the usual culprits when outreach backfires.
When to use simple scores versus predictive models? Start with transparent rules so operators can understand and tune behavior quickly. Move to predictive models only after you have stable labels from pilots and the capacity to monitor model drift — otherwise you trade speed and clarity for unexplainable decisions.
How do we prove a retention automation actually creates incremental value? Use a randomized holdout or a staggered rollout and measure a single primary KPI tied to revenue or behavior cycle. Keep the test homogeneous and run it for at least one full customer behavior cycle so you capture downstream effects, not just immediate clicks.
Which channels work best for urgent reactivation in consumer businesses? Use immediate channels for time-sensitive frictions (SMS and push), and richer channels (email) for value messaging. Reserve phone or concierge outreach for multi-signal, high-value customers so human time is targeted where it moves the needle.
Who needs to be in the room for a retention pilot? At minimum: CRM/growth to run playbooks, analytics/product to define signals and measure lift, engineering for event plumbing and identity, and frontline operations for human follow-up and capacity planning.
Operational limitation to watch for: automated detection without operational capacity to act creates worse experiences than no automation. If your human follow-up or refund/reschedule processes lag, throttle the automation or narrow the pilot to avoid creating broken promises.
Practical example: A regional wellness studio instrumented a payment-retry flow that first sent a retry link via SMS, then an email with a short plan suggestion, and only escalated to a staff call for members with a history of high lifetime spend. The studio limited human callbacks to profiles flagged by multiple signals so staff time focused where it mattered and the team avoided a flood of low-value callbacks.
Key caution: never deploy a full ramp of automated outreach without a small control group and a staffed escalation path. Measurement and operations must be wired before you expand; otherwise you trade short-term activity for long-term damage.
If you can only do three things right now: (1) instrument reliable events into your CRM, (2) build a simple, transparent at-risk score, and (3) run a small randomized pilot with a clear SLA for human follow-up.
Next actions you can implement this week: map two highest-confidence signals to CRM traits, create one low-friction playbook for those signals (SMS then email), and reserve a randomized 10–15 percent holdout to measure incremental reactivation.

Written by
Sarah Kim
Sarah is a CRM and customer data specialist who helps B2C brands turn raw data into personalised experiences. With a background in customer success, she writes about segmentation, customer journey mapping, and making the most of your CRM platform.
Recent blog posts
Back to blog

Ready to Run Successful Marketing Campaigns and Grow Your Business?
Gleantap helps you unify customer data, track behavior patterns, and automate personalized campaigns, so you can increase repeat purchases and grow your business.
Ready to Run Successful Marketing Campaigns and Grow Your Business?
Gleantap helps you unify customer data, track behavior patterns, and automate personalized campaigns, so you can increase repeat purchases and grow your business.