 Divya Ghughatyal
If acquisition costs are climbing and repeat behavior is inconsistent, this guide turns customer loyalty from a marketing slogan into a measurable growth lever. You will get a practical playbook for designing loyalty programs, where to apply loyalty & Gamification so it actually moves the needle, the tooling patterns (including Gleantap for messaging and automation), and exact ways to measure lift using Retention Rate and CLV. Expect cohort tests, ROI formulas, and a 30–90 day checklist you can run with limited engineering resources.
1. Why customer loyalty matters for growth
Retention rate drives economics. Small improvements in retention change customer lifetime value and CAC payback more than equivalent cuts in acquisition cost. Treat customer loyalty as a lever for unit economics, not a marketing vanity metric like program enrollments or social followers.
Retention math made concrete
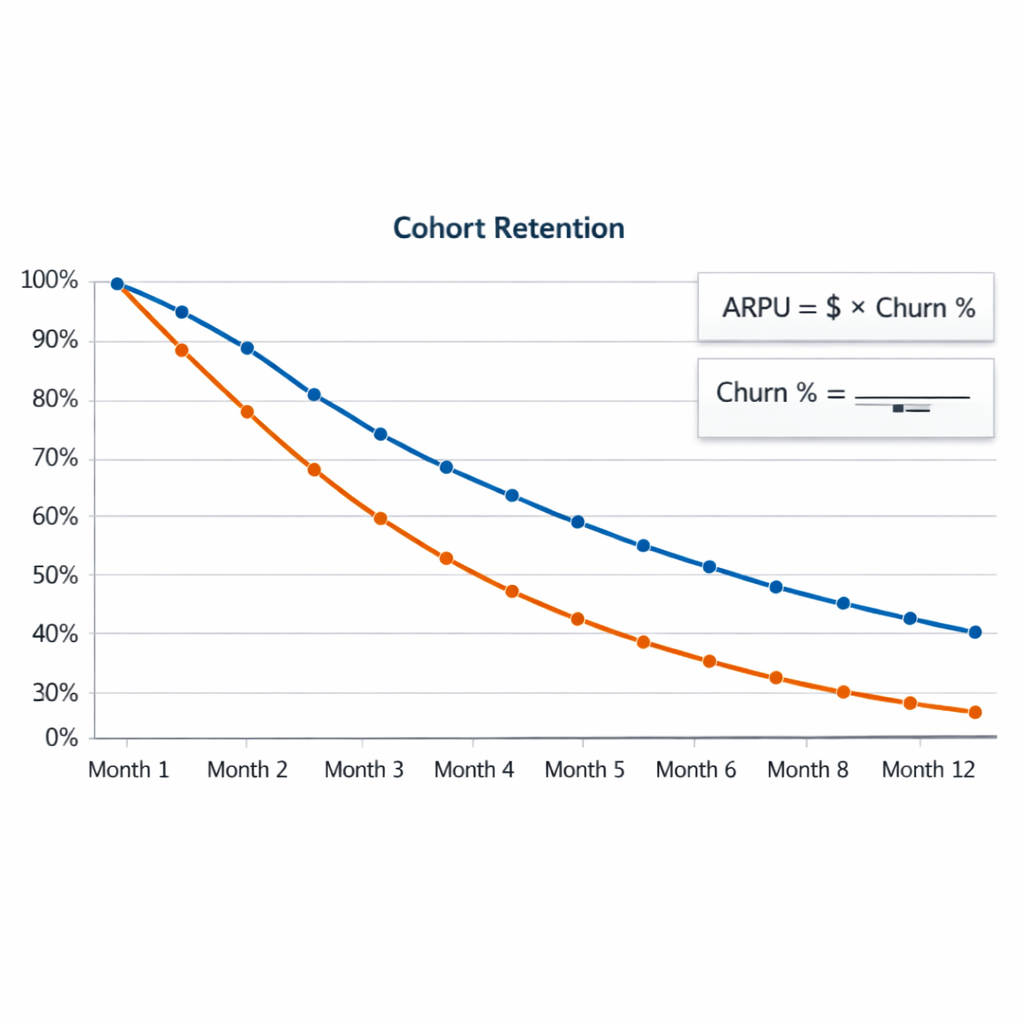
Simple formula to use every time: CLV ≈ ARPU / churn_rate when churn is measured for the same period as ARPU. Use cohort-based churn for accuracy. This makes the impact of a retention change immediate and measurable.
Worked example: A gym charges average revenue per user (ARPU) of $50 per month. If monthly churn is 6 percent, average lifetime is about 1 / 0.06 = 16.7 months and CLV ≈ $50 * 16.7 = $835. Lower churn to 5 percent and lifetime rises to 20 months, CLV ≈ $1,000. That 1 percentage point improvement in monthly churn increases CLV by ~20 percent and shortens CAC payback by four months if CAC is $200.
Practical tradeoff to watch. Loyalty programs raise retention but cost money and operational complexity. Rewarding price sensitive behavior with discounts can inflate short term frequency while compressing margin. Design rewards to reinforce profitable actions like higher spend per visit, referrals, or subscription upgrades rather than just lowering price.
How to use this in planning. Make retention rate the north star for loyalty initiatives and predict ROI by converting expected retention lift into incremental CLV and payback months. Run a holdout test and report cohort retention delta at month 1 and month 3 before rolling out rewards broadly.
Concrete example: A mid sized boutique gym launched a tiered rewards pilot that combined a 30 day visit streak badge and a referral credit. After a 60 day pilot with a 20 percent member holdout, the pilot group showed a 3 percentage point higher month to month retention and 12 percent higher spend from referral credits being used on add ons. The business used those cohort numbers to justify expanding the program and automating flows in Gleantap to reduce manual work.
- Measure what matters: Track cohort retention, revenue per active customer, and CAC payback rather than member count.
- Align rewards to margin: Prioritize rewards that increase visit frequency, AOV, or referrals over straight discounts.
- Experiment before scale: Use randomized holdouts or geo tests to measure incremental retention lift and avoid assuming correlation is causation.
Key stat: A 5 percent improvement in retention can increase profits by 25 to 95 percent depending on industry mix. See Bain and the analysis summarized in HBR for industry context.
Takeaway: If your loyalty effort cannot produce a testable retention lift that converts to increased CLV and faster CAC payback, it is a tactical distraction. Next consideration is how to measure the lift reliably with cohorts and instrument messages so you can attribute improvements to the program.
2. Measuring loyalty and retention: metrics, formulas, and dashboards
Start here: if you want to prove a loyalty program, measure cohort retention not aggregate active users. Cohorts tell you whether the same customers keep returning — which is the behavior loyalty programs are meant to change.
Core formulas you will use
Retention rate (period): (Customers active in period t+n who were active in period t) / (Customers active in period t). Example: 1,000 members billed in January and 830 billed in April = 83% retention over 3 months. Churn rate: 1 – retention. Repeat purchase rate: customers with 2+ purchases / total customers in a period. Simplified CLV: Average order value purchase frequency per period average lifetime (periods) – acquisition cost. Use these consistently across cohorts.
Practical tradeoff: choose cohort granularity based on business rhythm – weekly cohorts for daily-transaction businesses, monthly for subscriptions and gyms. Smaller cohorts give faster signals but more noise; larger cohorts reduce noise but slow decision cycles.
Cohort analysis template and a SQL starter
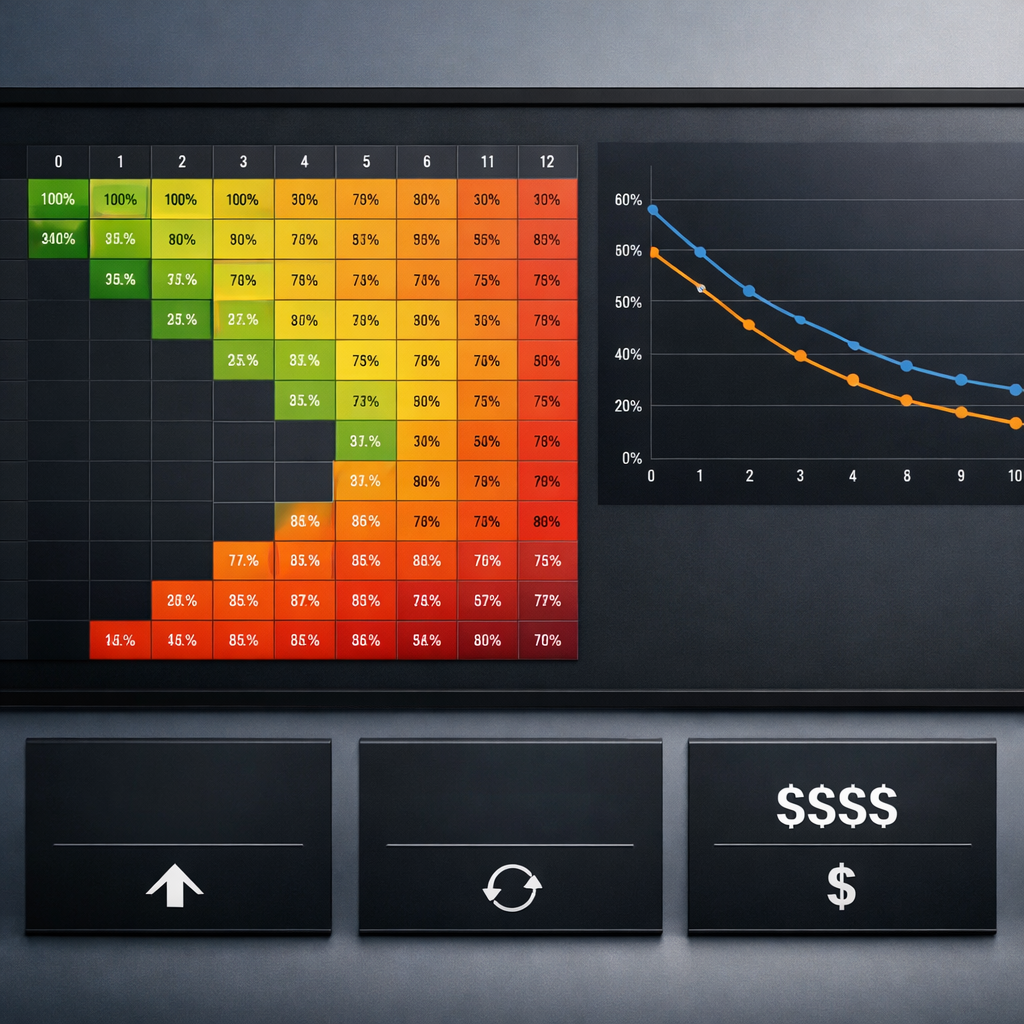
What to capture: cohort_date, user_id, event_date (purchase or visit), revenue, channel, loyalty_status. Track month 0 through month 12 retention as a heatmap and export the raw cohort table for statistical testing.
SQL starter (BigQuery style): SELECT cohort_month, MONTH_DIFF(event_date, cohort_date) AS months_after, COUNT(DISTINCT user_id) AS active_users FROM events WHERE event_type IN (purchase,visit) GROUP BY cohort_month, months_after Use this to build a heatmap matrix of retention proportions.
- Dashboard widgets to build: cohort heatmap (month 0-12), retention curve line for top acquisition channels, repeat purchase rate by cohort, revenue per active customer by cohort.
- Segments to compare: loyalty members vs non-members, paid acquisition vs organic, top 20% spenders by cohort.
- Alert rules: flag cohorts where month 1 retention drops by >5% vs prior cohort — investigate quickly.
Concrete example: A mid-market gym ran a 90 day pilot giving recurring-visit badges. Baseline cohort month 1 retention was 78%. After the pilot, the treated cohort showed 84% month 1 retention – an absolute lift of 6 percentage points. Translating that lift into CLV showed payback within 6 months because incremental visits increased membership add-ons and referrals.
Common blind spot: teams use before/after comparisons without a holdout. That overstates program impact. Always run a randomized holdout or geographic control when possible and measure incremental retention difference.
Key takeaway: focus on cohort retention and channel segmentation. Small retention lifts compound — as Bain shows, a few percentage points can swing profitability considerably. See Bain Company insights on loyalty and retention.
Next consideration: build the cohort table into your primary BI pipeline now so every loyalty test, gamification element, or membership change can be measured against the same baseline.
3. Loyalty program design that impacts retention
Key point: A loyalty program only impacts Retention Rate when its mechanics change actual customer behavior – not when it simply promises discounts. Design needs an explicit behavior-to-reward map, an economics check, and operational rules that keep redemption feasible.
Core components to design
- Program model: Choose tiered, points, or membership and align to your revenue cadence and margins.
- Target actions: Specify the exact behaviors you want to increase – visit frequency, spend per visit, referrals – and prioritize one or two to avoid diluting impact.
- Reward economics: Calculate break even cost per incremental visit or transaction before launch.
- Redemption UX: Keep redemption friction minimal – immediate, local, and trackable.
- Data and measurement: Capture events that map to cohort retention and instrument a control group for experiments.
- Fraud and expiry rules: Protect margins with sensible expiries and abuse detection.
Trade-off to accept: Simplicity wins operationally but can limit personalization. Complex tier rules or many earn paths increase perceived value for customers but also raise support load and implementation time. If you have limited engineering bandwidth, prefer a straightforward points-per-action model and add tiers later.
Practical break-even example
| Action | Reward | Cost per action | Average margin per action | Net per action |
| Gym visit | 10 points (redeemable for a $10 reward at 500 points) | $0.20 | $8.00 | $7.80 |
| Referral sign-up | $25 credit | $25.00 | $50.00 | $25.00 |
Concrete example: A midsize fitness studio gave 10 points per visit and 100 bonus points for a five-week streak, with 500 points = $10 credit. Using Gleantap for automated streak reminders and POS integration to record visits, the studio measured a 6 percent lift in month 2 retention among members who entered the streak funnel. Reward cost stayed within margin because average spend per visit was high and redemptions clustered on slow days.
Misunderstanding to avoid: Gamification is not the same as meaningful incentives. Progress bars and leaderboards increase engagement only when tied to measurable business outcomes such as higher visit frequency or referrals. Do not add gamified layers that customers enjoy but that do not move cohorts in your retention dashboard.
Implementation rule: Start with a single north-star behavior, run a 30 day pilot with a holdout, and measure cohort retention at month 1 and month 3 before expanding mechanics.
Design reminder: A small retention lift scales. Bain analysis shows a 5 percent retention increase can materially boost profits in many industries; build your break-even model with that leverage in mind. See Bain insights.
Next consideration: pick the primary retention metric your program will move, wire the event schema into analytics and Gleantap, and schedule a controlled pilot with a clear break-even calculation.
4. Where gamification belongs and how to apply it
Practical rule: use gamification only when it maps directly to a measurable retention or frequency behavior. If the mechanic does not change visit cadence, repeat purchase, or membership renewal it is decoration — pretty, distracting, and expensive.
When gamification is the right tool
- Behavior is repeatable and observable: customers take the same action regularly (visits, orders, workouts) so you can measure frequency changes.
- Short feedback loop: the reward or progress update happens soon after the action so the user sees cause and effect.
- Low redemption friction: customers can claim rewards without handoffs or long waits — otherwise the mechanic becomes a barrier.
- You can A/B test it: you can build holdouts (geo, cohort, or randomized) and measure Retention Rate and repeat purchase lift.
Useful gamification patterns and what they signal
- Progression bars (progress to next tier): signals that nudges customers to close the gap — effective for increasing visit frequency but weak if the gap is unrealistic.
- Streaks: build habit formation; best for daily/weekly actions. Risk: streak fatigue if rewards are too small.
- Missions or short challenges: good for re-engagement windows (7–30 day missions) and measurable with cohort retention.
- Social proof and leaderboards: drives community and advocacy in competitive categories (fitness, gaming); excludes casual users and can backfire if leaderboard leaders are unreachable.
- Tiered status: increases spend/AOV when tiers have clear, attainable benefits; costs escalate if benefits are too generous.
Trade-off to accept: gamification increases engineering and product complexity. Each mechanic requires event tracking, state management, customer messaging, and fraud controls — plan for maintenance, not just launch.
Implementation checklist (practical steps)
- Map actions to business outcomes: pick 1–2 behaviors (visit frequency, referral, AOV) and define the retention metric you expect to move.
- Choose the simplest mechanic that can move that metric: start with a progress bar or a 14-day streak before adding leaderboards.
- Instrument events and identity: capture events in your analytics and stitch identity to CRM/pos so you can measure cohort Retention Rate lift.
- Automate messaging for nudges and redemptions: use messaging to surface progress and reduce redemption friction — see content=null&utmsource=null&utmcampaign=null&utmmedium=null target=_blank>Maximizing Customer Loyalty for examples.
- Run a controlled experiment: use a randomized holdout and measure month 1 and month 3 retention cohorts before full rollout.
Concrete example: A boutique gym implemented a 21-day visit streak with a visible progress bar and automated SMS nudges for members who missed two scheduled sessions. The stack used the membership system to emit visit events, Gleantap for SMS triggers, and cohort analysis to compare a holdout group; the program increased 30-day retention in the test cohort and paid for its small reward budget within six weeks.
Misunderstanding to avoid: teams assume gamification equals engagement. In practice it often raises superficial metrics (app opens, badge counts) without moving Retention Rate or CLV. Design for the business outcome, not the badge.
Key judgment: prefer short, measurable mechanics tied to a single retention KPI. Expand complexity only after proven lift.
Hard fact: a small percentage lift in retention scales dramatically — even a 5% improvement can materially change LTV and payback. See Bain for the underlying economics: Bain Company insights on loyalty and retention.

5. Tools and integration patterns for loyalty and retention
Start with events and identity, not features. Your stack should be designed around a clean event schema and deterministic identity stitching so rewards, messaging, and analytics all reference the same customer record. Without that, points get lost, messages appear off, and cohort-based Retention Rate calculations are meaningless.
Core integration patterns
- CDP-first pattern: Capture all client and server events into a CDP (Segment, Rudderstack) then fan out to analytics (Snowflake/Looker), loyalty engine (Smile.io, LoyaltyLion, Annex Cloud), and messaging (Gleantap or Klaviyo). Best when you need unified identity and analytics.
- Event-driven, real-time pattern: Checkout or visit triggers a server-side event to a loyalty engine API and returns updated balance instantly; a webhook notifies your messaging layer to send a receipt or reward. Use this when immediate feedback (stars, points) affects on-site behavior.
- Batch-sync pattern for legacy POS/membership systems: Export daily transactions to a middleware (Airbyte / ETL) that writes to your loyalty ledger and analytics. Lower engineering cost but expect up to 24-hour delay in reward state.
- Middleware microservice pattern: Run a small, hosted service that handles idempotency, reconciliation, and mapping between POS, membership systems (Mindbody, Zen Planner), loyalty engine, and Gleantap. This reduces vendor coupling and eases future vendor swaps.
Identity stitching rules matter. Use a stable primary key (company customer_id), then fall back to phone and email. Persist device IDs and reconcile with periodic fuzzy-matching routines to avoid duplicate accounts — duplicates are where fraud and bad redemption rates hide.
Concrete Example: A mid-size gym uses ___CODE0 for memberships, CODE1 for points, CODE2 as the CDP, and CODE3___ for SMS automation. When a member checks in, Mindbody emits a server event to Segment; Segment forwards it to Smile.io to award points and triggers a webhook to Gleantap to send a streak reminder. Analytics in Snowflake shows the cohort Retention Rate lift at day 30 and 90.
Trade-offs and limitations you must decide on. Real-time integrations give better customer experience but require engineering time and robust idempotency controls; batch syncs are cheaper but blur the impact timing of loyalty mechanics on visit frequency. Vendor-managed loyalty engines speed time-to-value but can limit custom gamification and create data export friction.
Operational pitfalls to watch for. Offline POS reconciliation, simultaneous redemptions, and gift-card style semantics create race conditions. Require idempotent APIs on your middleware, add server-side checks in the loyalty engine, and log all state changes for auditability so your Retention Rate and redemption KPIs are trustworthy.
Quick vendor checklist: API-first + webhook support; raw event export to warehouse; SDKs for web/mobile; offline import and reconciliation; SLAs for webhooks; pricing aligned to your metric (transactions vs MAUs). Start with an MVP: messaging + points ledger + cohort dashboard before adding tiers or complex missions. See the Gleantap partner program for implementation help: content=null&utmsource=null&utmcampaign=null&utmmedium=null target=_blank>How to Become a Partner – Gleantap.
Implement the cheapest integration that proves retention lift. If it moves Retention Rate at a cohort level, invest in real-time polish next.
6. Measuring incremental impact and calculating ROI
Start with a clean counterfactual. The only defensible claim about a loyalty program is the incremental change versus what would have happened without it. That means a randomized holdout or a comparable geo holdout, predefined primary metric, and a measurement window long enough to capture delayed effects on repeat customers and churn.
Experiment design essentials
Design rules. Use randomized assignment when you can. If engineering or UX constraints prevent randomization, use geo holdouts or time-based rollouts with matched cohorts. Pre-register the test window, primary metric (retention_rate by cohort at month 1, month 3, month 6), sample size, and success threshold so you avoid post hoc reasoning.
- Primary metric first: Choose a retention definition that maps to value for your business – active membership for gyms, repeat purchase within 90 days for retail. Use cohort retention curves rather than single-point snapshots.
- Power and sample size: If baseline month-to-month retention is 60 percent and you want to detect a 4 percentage point lift with 80 percent power and 5 percent alpha, expect to need several hundred customers per arm. Use a sample size calculator rather than eyeballing.
- Intermediate signals: Track engagement events that should move first – open rates, mission completions, redemption rate. They are useful diagnostics but not substitutes for the primary retention outcome.
- Duration and contamination: Run long enough to see sustained effects and watch for cross-over where holdout customers get exposed through referrals or marketing.
Converting retention lift to CLV and profit
Step by step conversion. Convert absolute retention lift into incremental customers, then multiply by expected future revenue per customer and margin to get incremental gross profit. Subtract program cost and compute ROI and payback period. Use conservative assumptions for remaining lifetime and margin to avoid overclaiming impact.
| Metric | Value | Explanation |
| Treated customers | 1,000 | Customers in the loyalty pilot arm |
| Absolute retention lift at month 3 | 4 percent | Treated retention 64 percent vs control 60 percent |
| Incremental retained customers | 40 | 1,000 * 0.04 |
| Avg monthly revenue per customer | $50 | Revenue averaged over recent cohort |
| Gross margin | 50 percent | Contribution margin on incremental sales |
| Expected remaining months | 10 | Conservative estimate based on churn analysis |
| Incremental gross profit | $10,000 | 40 $50 10 * 0.5 |
| Program cost | $2,500 | Rewards, tooling, agency or engineering |
| Net incremental profit | $7,500 | Incremental gross profit minus program cost |
| Payback period | 2.5 months | Program cost / (incremental gross profit / expected months) |
Concrete example: A boutique gym runs a 1,000-member pilot with a tiered streak reward. After 90 days the pilot arm shows a 4 percent absolute lift in active membership versus holdout. Using average monthly dues of $50 and 50 percent margin, the gym converts that lift into $10,000 incremental gross profit and recovers program cost in under three months. For a small business this is fast, measurable payback and justifies scaling.
Practical tradeoffs and limits. Short tests favor detectability but miss long tail effects like lifetime loyalty or advocacy. Larger, longer tests cost time and capital. Be skeptical of small absolute lifts reported without confidence intervals or without accounting for cannibalization where rewards simply shift timing of purchases rather than creating net new revenue.
Attribution pitfalls to watch for. Redemption cannibalization, selection bias from voluntary enrollment, and concurrent marketing campaigns are the usual offenders. Use intent-to-treat analysis to avoid overstating effects, and run sensitivity checks that subtract estimated cannibalized revenue.
- Report what matters: retention by cohort with confidence intervals, incremental revenue per retained customer, redemption rate, program cost per incremental retained customer, CLV uplift, and payback period.
- Automate the dashboard: push cohort tables and ROI calculations into your BI tool and use messaging platforms like content=null&utmsource=null&utmcampaign=null&utmmedium=null target=_blank>Gleantap for experiment targeting and operational tracking.
- Read the evidence: Ground your business case in sources such as Bain for retention economics and HBR for experience to value linkage.
Key takeaway: Run randomized holdouts where possible, convert absolute retention lift into incremental customers, and use conservative lifetime and margin assumptions. Program ROI must be reported as net incremental profit and payback period, not just higher engagement metrics.
7. Real world examples and a 90 day implementation roadmap
Direct observation: most loyalty pilots fail not because the idea is bad but because teams try to build the entire program at once. Start small, measure retention rate impact, then scale. Prioritize implementable mechanics that map to a single behavior you can measure.
Real examples that inform your roadmap
Concrete Example: A regional gym chain reduced 30 day churn by 18 percent using a two-pronged approach: automated SMS check-in nudges for members with zero visits in 14 days and a simple visit-streak reward that unlocked a free personal training session after four consecutive weeks. Implementation required no loyalty engine – just Gleantap for messaging, membership data from the POS, and a small webhook to flag streak completion.
Use case to copy: a boutique e-commerce brand launched a two-tier VIP program limited to repeat buyers. Tier benefits were operationally simple – free expedited shipping and early access – and the brand tracked increase in average order value and repeat purchase frequency rather than chasing vanity metrics like app opens.
Practical trade-off: prioritize speed-to-value over completeness. A 30 day MVP that changes one measurable behavior is far more informative than a 6 month build with unclear KPIs. The downside is you may need to refactor data models later – accept that cost and budget it into the 60 day work.
90 day implementation roadmap – clear owner roles and checkpoints
- Day 0-14 – Discovery and baseline: define your north star cohort and capture baseline retention rate, repeat purchase rate, and CLV for that cohort. Assign owners: marketing for creative, analytics for cohort queries, engineering for integrations.
- Day 15-30 – MVP build and small holdout: pick one high-impact mechanic – onboarding bonus, reengagement SMS, or referral credit. Implement messaging flows in Gleantap or your messaging tool, create a 10-20 percent randomized holdout for measurement, QA redeem flows, and soft-launch to 20 percent of target users.
- Day 31-60 – Measure and iterate: analyze early lift at day 7 and day 30 using cohort windows. Fix friction points in redemption and identity stitching. If reward economics look poor, lower reward cost or raise the behavior threshold. Prepare expanded engineering work for loyalty datastore if needed.
- Day 61-90 – Scale with guardrails: expand to full audience, add a second mechanic if justified (referrals or tiering), enable automations for lifecycle stages, and finalize fraud and expiry rules. Present retention lift, incremental CLV, and payback timeline to stakeholders.
Measurement note: always run a holdout. Observational before-after comparisons will mislead you when seasonality or marketing spend changes. Use the experiment frameworks in section 6 and report retention rate by cohort to prove causality.
| Checkpoint | Primary KPI | Success threshold |
| Day 30 | Month-1 retention for exposed cohort | +3 to 5 percentage points vs holdout |
| Day 60 | Repeat purchase rate | +5 to 10 percent relative lift |
| Day 90 | Incremental CLV and payback period | Positive incremental margin within 6-12 months |
Key stat: a small retention uplift scales. Bain analysis shows a 5 percent retention increase can raise profits 25 to 95 percent depending on industry – use this when prioritizing budget. See Bain insights.
Operational warning: if your customer identity is fragmented across POS, CRM, and web, fix identity stitching before launching complex rewards. Bad data creates reward abuse, inaccurate retention measurement, and wasted spend.
Next consideration: after day 90, convert learnings into a prioritized backlog – data fixes first, then reward economics, then richer gamification. See the gym implementation guide for tactical messaging examples: content=null&utmsource=null&utmcampaign=null&utmmedium=null target=_blank>Your Complete Guide to Opening a Successful Gym Business.
Frequently Asked Questions
Quick orientation: These answers skip definitions and go straight to what you must decide, measure, and avoid when you run loyalty, gamification, and retention experiments.
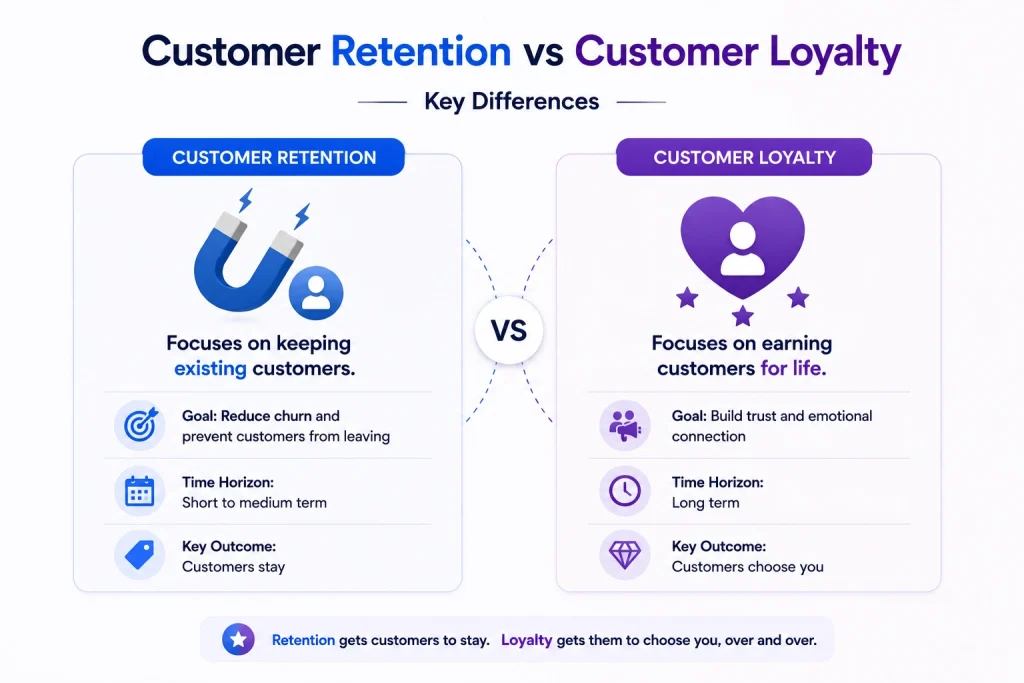
- Retention rate vs churn: Track retention as your north star. Churn is a useful diagnostic but not the operating metric for experiments because retention shows the positive change you can monetize.
- When to use gamification: Use gamification when behavior has a measurable habit path (visit frequency, weekly workouts, recurring purchases). If you cannot link the mechanic to a concrete event you can track, stick to simple points and rewards.
- Metrics to judge a 90 day pilot: Look for cohort retention at month 1 and month 3, repeat purchase frequency, and active member rate (customers who took a target action in the period). Also measure reward cost per incremental retained customer to check unit economics.
- Minimum tech for an MVP: A messaging automation tool (___CODE0 or CODE1___), a simple points store (can be a dedicated loyalty engine or a tracked table), and one analytics table for cohort queries is sufficient.
- Sample size and test duration: For a retention lift target of 2–3 percentage points, block randomize at the user level and run 8–12 weeks. If weekly activity is low, extend to 12 weeks. Underpowered tests generate false negatives more often than useful signals.
Practical tradeoff: Faster launches favor vendor solutions; custom mechanics favor building. Vendors reduce engineering time but constrain future product differentiation and add recurring costs and potential data reconciliation overhead.
Concrete example: A 1,800-member gym built a simple pilot: members were split into holdout and treatment. Treatment received automated SMS triggers for 7-day missed visits plus a 3-week visit streak challenge with a free guest pass at completion. After 90 days the team saw a 3 percent absolute lift in active members in the treatment cohort, which paid back the guest pass and messaging cost inside two months.
Attribution and common mistakes: Do not attribute all revenue lift to the loyalty mechanic. Control for promotional cadence, seasonality, and acquisition channel. Also watch enrollment vs engagement: high enrollment with low usage is a vanity metric.
Tactical threshold: For an MVP, aim for a 1–3 percentage point absolute monthly retention lift or a 5–10 percent relative lift. If you cannot detect that with your cohort sizes, either lengthen the test, raise treatment intensity, or reduce noise sources.
Next actions: 1) Pick one measurable behavior to change, 2) design a holdout test (8–12 weeks) with tracked events, 3) set a realistic retention lift target and reward cost ceiling, 4) instrument cohort dashboards and run the pilot.

Ready to Run Successful Marketing Campaigns and Grow Your Business?
Gleantap helps you unify customer data, track behavior patterns, and automate personalized campaigns, so you can increase repeat purchases and grow your business.
Ready to Run Successful Marketing Campaigns and Grow Your Business?
Gleantap helps you unify customer data, track behavior patterns, and automate personalized campaigns, so you can increase repeat purchases and grow your business.